Emini profit taking at 2800 and triple top
I will update again at the end of the day.
Pre-Open market analysis
Yesterday sold off, but held just above Monday’s low and last week’s low. The bulls hope that the selloff was a test of those lows. They therefore want a micro double bottom on the daily chart, and then a resumption of the 2 month bull trend.
However, Monday’s selloff was exceptionally strong. Furthermore, it came at major resistance at the October-November-December triple top and 2800. Finally, the weekly chart is in an extreme buy climax. Therefore, Monday is probably the start of at least a 2 – 3 week pullback.
Because the bull trend has been so strong, the Emini might have to spend more time going sideways before traders conclude that the price is too high. But, the Emini will likely trade sideways to down for at least a couple more weeks. This is true even if it trades back above 2800 over the next week.
The key piece of information remaining this week is the close of the week. If the week closes near its low, the odds of a 2 – 3 week selloff will be greater. If instead the week closes in its middle, the Emini might go sideways for another week or two before pulling back.
It is possible that the Emini will break above the triple top before pulling back. However, the odds of a strong leg up from here are small without a 2 – 3 week pullback first.
Overnight Emini Globex trading
The Emini is up 3 points in the Globex session. It tested last week’s low yesterday. Since this week is the 1st pullback in 10 weeks, there are probably many bulls who are eager to buy the pullback. That could lead to a rally today up from last week’s low.
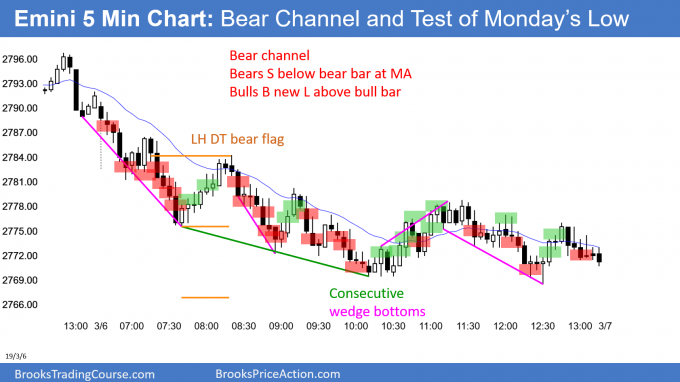
Additionally, yesterday was a bear channel. A bear channel is a bull flag. Traders expect a breakout above yesterday’s bear trend line today. That would probably end yesterday’s selling. Therefore, today will probably be either a bull trend day or a trading range day.
Yesterday’s setups

Here are several reasonable stop entry setups from yesterday. I show each buy entry with a green rectangle and each sell entry with a red rectangle. I rarely also show limit order entries and entries on the close of bars. My goal with these charts is to present an Always In perspective. If a trader was trying to be Always In or nearly Always In a position all day, and he was not currently in the market, these entries would be logical times for him to enter.
EURUSD Forex market trading strategies

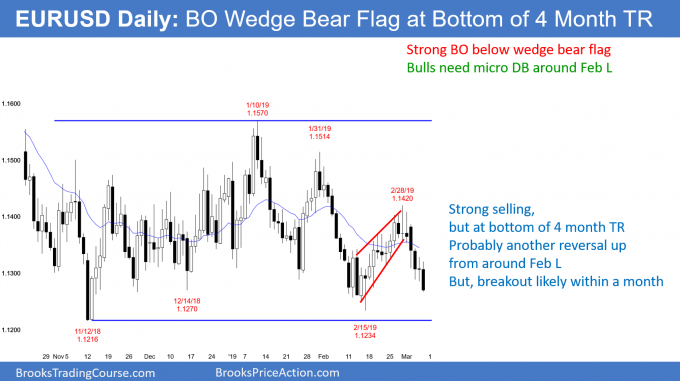
The EURUSD daily Forex chart broke below a wedge bear flag last week. The 6 day breakout has been strong. Furthermore, the 4 month trading range will likely break out within a month and have about a 300 pip measured move.
Because a breakout is likely soon and the momentum down is good, there is an increased chance that this week’s selloff is the start of a bear trend. However, trading ranges resist breaking out. There have been many strong legs up and down over the past 4 months. Each has reversed. Consequently, despite the momentum down, the odds continue to favor reversals instead of breakout.
The bulls tried to form a higher low yesterday on the 60 minute chart. Overnight, the chart broke to the downside. It is now testing the trading range low.
Even if the bulls get a double bottom with the February low, they will probably need a 2 – 3 day micro double bottom first. Typically, the chart needs to stop the selling for a few days before the buying can begin.
Overnight EURUSD Forex trading
The EURUSD 60 minute Forex chart tried to form a higher low and reversal up yesterday. However, the 5 minute chart broke strongly below that bottom overnight. The selloff has been strong enough to make at least a small 2nd leg down likely later today or tomorrow.
While the odds still favor a reversal up from the 1.12 bottom of the 4 month range, this trading range has been unusually long. Therefore, traders know that a breakout up or down is likely within a month. The bears need 2 closes below the bottom of the 4 month range to convince traders that a bear trend is underway.
If it is, most days will be bear days. Traders will look to sell rallies and breakouts. In addition, day traders will look for 30 – 50 pip swing trades. The selloff over the past hour is an example.
Is the character of the market changing on the daily chart from a trading range to a bear trend? If the 5 minute chart begins to have several days with bear swings of 50 or more pips, like today, it probably is.
Can today reverse up? Probably not. The best the bulls can probably get today is a small trading range. Day traders will look to sell rallies until a trading range forms. Once one does, they will also scalp reversals up.
Summary of today’s S&P Emini futures price action and what to expect tomorrow

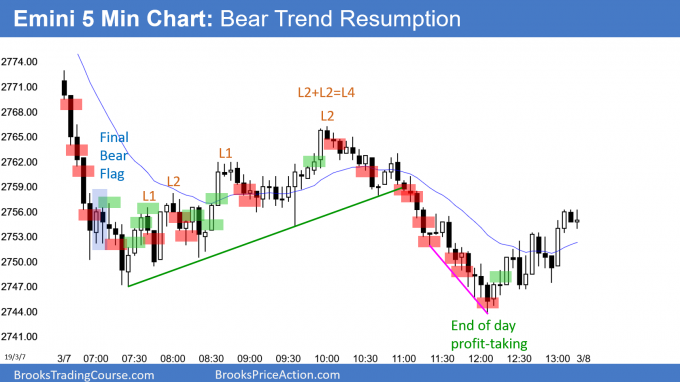
Here are several reasonable stop entry setups for today. I show each buy entry with a green rectangle and each sell entry with a red rectangle. I rarely also show limit order entries and entries on the close of bars. My goal with these charts is to present an Always In perspective. If a trader was trying to be Always In or nearly Always In a position all day, and he was not currently in the market, these entries would be logical times for him to enter.
End of day summary
The Emini sold off strongly on the open, but then rallied for several hours. The bears got trend resumption down to a new low later in the day. However, there was late profit-taking rally, and there is now a wedge bull flag on the 60 minute chart.
Tomorrow is important. The week is outside down. The bears want the week to close below last week’s low. If they succeed, the odds of a deeper and longer pullback will increase. The bears do not need the market to sell off any further tomorrow. If they simply keep the Emini around its current level, they will have accomplished their goal.
Since the bulls always want the opposite, they will try to create a rally to above last week’s low by tomorrow’s close. They also want the week to close above the 20 day EMA. With today forming a wedge bull flag, there is an increased chance of a rally tomorrow.
Whatever happens tomorrow, the odds are that the Emini will go more sideways to down for at least a couple weeks.
See the weekly update for a discussion of the price action on the weekly chart and for what to expect going into next week.
Trading Room
Traders can see the end of the day bar-by-bar price action report by signing up for free at BrooksPriceAction.com. I talk about the detailed S&P Emini futures price action real-time throughout the day in the BrooksPriceAction.com trading room. We offer a 2 day free trial.
Charts use Pacific Standard Time
When I mention time, it is USA Pacific Standard Time (the Emini day session opens at 6:30 am PST, and closes at 1:15 pm PST). You can read background information on the intraday market reports on the Intraday Market Update page.


Al,
In your end-of-day chart you say you try to present an Always In perspective. But you often mark good long swing trades when the market is still AIS and vice-versa, correct? It would be quite helpful for me, and others I assume, if you could mark where the market changes Always In direction, perhaps just with an up arrow below the bar where it changes to AIL, etc.
In the chart today for example, did we go AIS around bar 29 after two good bear bars, or was there not enough selling pressure until 17-20 bars later?
thanks
Hi Matthew, it would not be helpful to me.
Market changes constantly and good entry with good context can change AI direction or just become TR.
Knowing the previous strengh of move is important, but its even more important
actively revalue and read whats happening.
Final bear flag can make market look like AI, but it can actually be setting up MTR for long, which has probobability of having TR and prolong sideway action (time) can flip market to 50% BO mode. I think the best think is to choose one context, observe, learn it and execute it without cherry picking.