Emini pulling back from January parabolic wedge exhaustive buy climax
I will update again at the end of the day.
Pre-Open market analysis
Yesterday triggered a buy signal on the daily chart by trading above Friday’s high. However, yesterday was a trading range day and it had a bear body on the daily chart. This is therefore a weak entry for the bulls.
That makes sense because after 7 consecutive bull bars on the weekly chart, this week will probably close below the open. Consequently, traders will look to sell rallies this week.
After a 7 week bull micro channel, there will probably be buyers not far below last week’s low. If the bears get a reversal down this week, it will probably only last 2 – 3 weeks.
With limited near-term upside and downside, the Emini will probably begin to form a trading range for the next 2 – 3 weeks. Since the daily and weekly charts are in buy climaxes, there is an increased chance of a surprise bar down on the daily chart this week.
Overnight Emini Globex trading
The Emini is up 19 points in the Globex session. It will therefore gap up. This will create a 3 day island bottom.
When there is a gap up, there is an increased chance of a trend. A gap up makes a bull trend slightly more likely than a bear trend. However, the weekly chart will probably have a bear body this week. Therefore, the odds are against a strong trend up from here that lasts more than a couple days.
A big gap up only has a 20% chance of leading to a strong trend from the open. Most of the time, there is at least one reversal in the 1st hour. The bulls will look for a wedge bull flag or a double bottom around the EMA.
The bears want a wedge top or a double top. Therefore, there will probably be a trading range for the for hour or so, even if there is a strong initial move up or down.
Yesterday’s setups

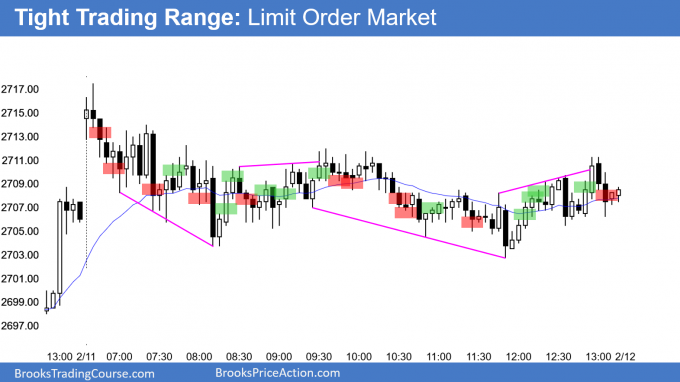
Here are several reasonable stop entry setups from yesterday. I show each buy entry with a green rectangle and each sell entry with a red rectangle. I rarely also show limit order entries and entries on the close of bars. My goal with these charts is to present an Always In perspective. If a trader was trying to be Always In or nearly Always In a position all day, and he was not currently in the market, these entries would be logical times for him to enter.
EURUSD Forex market trading strategies

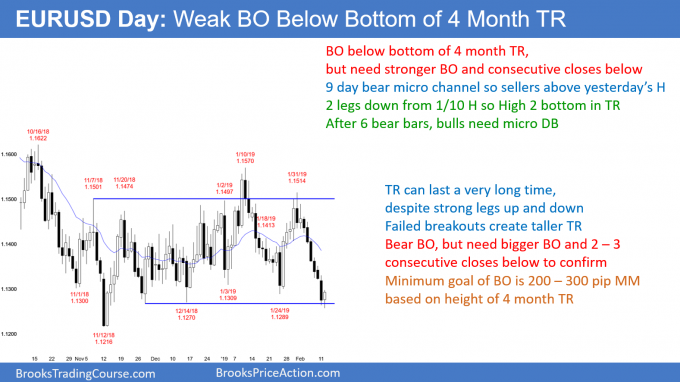
The EURUSD has fallen from above to below the 4 month trading range over the past 2 weeks. Just like the bulls needed additional bars at the top to confirm the bull breakout, the bears need to do more at the bottom.
Typically, traders want to see consecutive closes to confirm a breakout. But that is the minimum. The bears want consecutive big bear bars closing far below the range. If they get that, traders will conclude that the trading range has converted into a bear trend. Without that, this 2 week selloff will probably be just another strong leg in the trading range.
Bear leg in trading range or bear breakout?
What happens over the next few days is important. Yesterday had a big range and it therefore was a sell climax. With today so far being a bull reversal day, yesterday might be simply a sell vacuum test of the bottom of the range.
While it is possible for the 2 week bear trend to continue today, the sell climax and bull bar today make a pullback likely. The bears want the reversal up to fail.
Overnight EURUSD Forex trading
After breaking below the December 14 bottom of the trading range yesterday, the EURUSD 5 minute chart reversed up overnight. The reversal has only been 50 pips. This is small compared to the 250 pip selloff over the past 2 weeks. However, the bears are taking profits and the bulls are starting to buy. This will probably stop the selling for a few days.
There will probably be a 100 pip rally to above yesterday’s sell climax high. That will also be a test of the 20 day EMA. Consequently, the strong bear trend will likely convert into a small trading range today.
The bulls are buying for a 2 – 3 day short covering rally. Traders expect a trading range for a few days. Consequently, day traders will be looking for 10 – 30 pip scalps up and down for the rest of the week. Once the rally reaches the 20 day EMA, the bears will sell again.
Bulls need micro double bottom, bears need micro double top
If the bulls get a couple small pushes up, but the rally stalls around the 20 day EMA, the bears will see a Low 2 bear flag. They will sell below a bear bar after the micro double top and again try to break far below the 4 month range.
After a 9 day bear micro channel, the bulls will probably need a micro double bottom before they can create a swing up to the middle of the 4 month range. That means that even the bulls expect that the 1st rally will only last 1 – 3 days. They usually need 2 tests of the support (here, the bottom of the 4 month range) before they can create a swing up.
If they get that, then this selloff will just be another leg in the trading range. Trading ranges are filled with 2 legged moves. This would just be 2 legs down from the January 10 high.
Summary of today’s S&P Emini futures price action and what to expect tomorrow

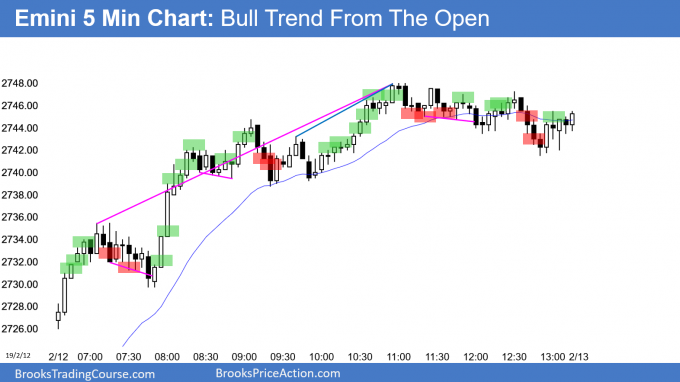
Here are several reasonable stop entry setups for today. I show each buy entry with a green rectangle and each sell entry with a red rectangle. I rarely also show limit order entries and entries on the close of bars. My goal with these charts is to present an Always In perspective. If a trader was trying to be Always In or nearly Always In a position all day, and he was not currently in the market, these entries would be logical times for him to enter.
End of day summary
The Emini rallied strongly to above last week’s high. There was a wedge top and a parabolic wedge top, and they led to an end of the day tight trading range.
This week is the 8th consecutive bull bar on the weekly chart. That may never have happened in the 100 year history of the S&P. It has probably never happened in the Emini. It is therefore unsustainable and climactic. Consequently, either this week or next week will probably be a bear bar on the weekly chart. But, after 8 bars up on the weekly chart, the bulls will buy the 1st 1 – 3 week pullback.
See the weekly update for a discussion of the price action on the weekly chart and for what to expect going into next week.
Trading Room
Traders can see the end of the day bar-by-bar price action report by signing up for free at BrooksPriceAction.com. I talk about the detailed S&P Emini futures price action real-time throughout the day in the BrooksPriceAction.com trading room. We offer a 2 day free trial.
Charts use Pacific Standard Time
When I mention time, it is USA Pacific Standard Time (the Emini day session opens at 6:30 am PST, and closes at 1:15 pm PST). You can read background information on the intraday market reports on the Intraday Market Update page.
Hi Al,
selling 32 I assume qualify as 40% prob. trade. 2 bars later you get your risk reward 1:1 target.
Bars 35,36,37 and 38 as PB would be pretty much expected and 39 and 40 is what you wanna see. But than close of 40 above prev. HL and bad follow 41, give you enough evidence to close innitial low prob trade from 32 on be?
Or would you wait to see what BO is like and scale in since limit bears made money selling previous high 22?
I know it depends on traders taste and account, but technicly speaking, taking a trade like at bar 32 shouldn` trader expect scaling in, using more complex trade management, etc. before even considering taking such a trade to ofset low prob. by higher profit? Or would you offset low trade prob by closing it on be or taking a small profit?
I guess back to squre one depends on the trader.
thx for any comment
thx
Al,
You mention being the 8 consecutive bull bar on the weekly chart, and therefore being climactic, you also state that it’s never been like that in last 100 years. However when I look at weekly charts (daytime session only) I do see many times 7-9 consecutive bull bars (some of them are dojis) but so is last weeks in our case. What am I missing?
Specifically the weekly chart
From Friday 01/06/17 to Friday 03/03/17 we have 9 bull bars as well.
You are right. I did not have much time to write today’s report. I looked more carefully after I wrote it and found some other examples as well. Because I did not have the time to look carefully when I wrote the above, I said “probably.”
The point I was making is that it is unusual and therefore unsustainable and climactic. I believe my conclusion is still correct. The streak will probably end this week or next with a minimum of 2 – 3 weeks of pulling back to either the February 8 low or, more likely, the January 23 low at the start of the wedge bull channel.