Emini and Forex Trading Update:
Wednesday June 3, 2020
I will update again at the end of the day.
Pre-Open market analysis
The Emini yesterday broke above the May high and closed on its high. Traders expect the rally to continue up to the March 3 high of 3125.75. At that point, the bears will sell, looking for a 15% correction. The bulls will continue to buy, hoping for a new high of the year. Currently, the bear case is stronger. The Emini will probably begin to pullback for a month or more once it gets to 3,100 – 3,150.
Since the rally has been strong and there is room to the target, the Emini should work higher. There can be a 1 – 3 day pullback at any time. However the bulls have bought every brief pullback for 2 months. They will continue to buy them until the Emini reaches the target.
The Emini has been getting vacuumed up there over the past 3 days. The bears do not want to sell yet because they are confident that the rally will reach the March 3 high. Why sell below when you believe you can sell higher?
Also, the bulls are increasingly confident that the rally will soon get there. Consequently, they are buying every intraday selloff, confident that they will make money.
This lack of selling and the aggressive buying creates a vacuum up to important resistance. The Emini is currently in a buy vacuum, which is an acceleration up late in a bull trend and a type of buy climax.
Overnight Emini Globex trading
The Emini is up 18 points in the Globex session. It is testing the 3,100 Big Round Number. Will it reach the March 3 high of 3125.75 today? It’s possible.
It will open far above the 20 bar EMA on the 5 minute chart. Traders do not like to buy far above the average price unless the early bars are far above average. For example, if the 1st 2 bars are big bull bars closing near their highs, day traders will be more willing to buy at the high.
But 80% of the time when there is a big gap up, there is some early trading range trading within the first hour or two. The bulls want to buy closer to the EMA. They look for a double bottom or a wedge bottom there.
The bears want to sell a rally to a wedge top or a double top. It typically takes an hour or two for these patterns to form. There is only a 20% chance of a strong trend up or down from the 1st bar.
Yesterday’s setups

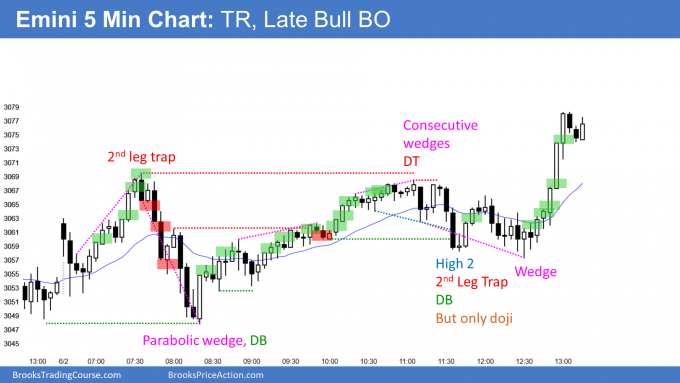
Here are several reasonable stop entry setups from yesterday. I show each buy entry with a green rectangle and each sell entry with a red rectangle. I rarely also show limit order entries and entries on the close of bars. I do not want the lines to be distracting. If they are longer, I make them dotted. But, they have to be visible, so I make the shorter ones solid. Buyers of the Brooks Trading Course and Encyclopedia of Chart Patterns have access to a much more detailed explanation of the swing trades for each day (see Online Course/BTC Daily Setups).
My goal with these charts is to present an Always In perspective. If a trader was trying to be Always In or nearly Always In a position all day, and he was not currently in the market, these entries would be logical times for him to enter.
If the risk is too big for your account, you should wait for trades with less risk or trade an alternative market like the Micro Emini.
EURUSD Forex market trading strategies

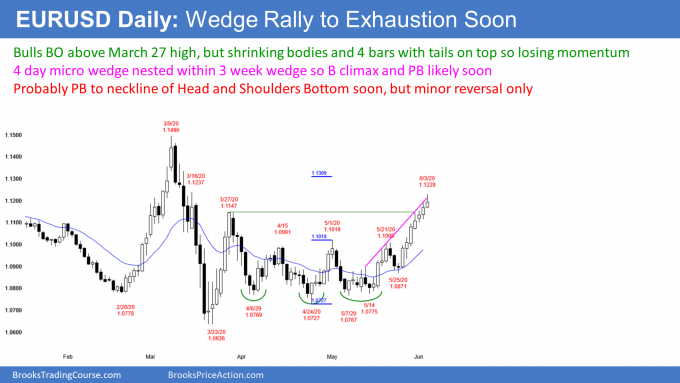
The EURUSD Forex market on the daily chart has broken above its 2 month trading range. That trading range was also a head and shoulders bottom. Traders expect a pullback to the neckline soon. That is the May 1 high at around 1.10.
The past 4 candlesticks on the daily chart days have prominent tails on top. That is a sign of minor selling. It is a micro wedge, which is a wedge on a smaller time frame. It is an early sign that the bulls are getting exhausted.
There are also 3 legs up from the May low. That is a wedge, and now the 3rd leg up contains a micro wedge. A nested pattern is more likely to result in a minor reversal. Traders expect a pullback to 1.10 to begin within a few days.
But the 3 week rally is strong. Consequently, if there a reversal next week, it will probably be minor. Traders will look to buy around 1.10 and the 20 day EMA.
Overnight EURUSD Forex trading
The 5 minute chart of the EURUSD Forex market rallied early in overnight trading and then pulled back. Traders are becoming less interested in buying at the high and now are wanting to buy pullbacks. This is an early sign of a market transitioning from a strong trend into a trading range.
The bears are now more willing to sell. For 6 days, its been much easier for day traders to make money by focusing on buying. They now are also looking to sell reversals down from the high.
For the past few days, day traders have been mostly scalping for 10 – 20 pips. That is what they have been doing overnight. They will likely continue throughout the day.
Because there is a nested wedge on the daily chart, day traders know there is a reduced chance of a big rally from here. Also, there is an increased chance of one or more bear trend days within the next week.
Summary of today’s S&P Emini futures price action and what to expect tomorrow

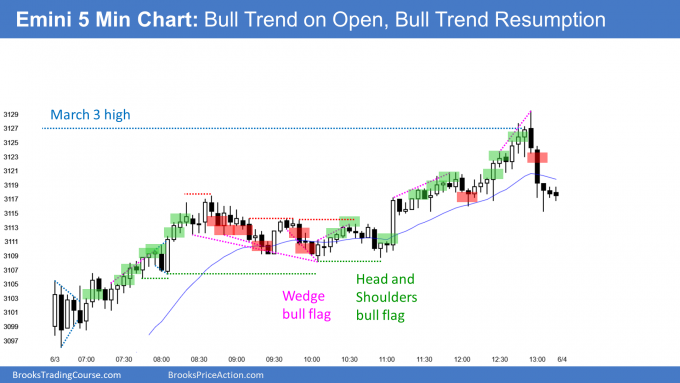
Here are several reasonable stop entry setups for today. I show each buy entry with a green rectangle and each sell entry with a red rectangle. I rarely also show limit order entries and entries on the close of bars. I do not want the lines to be distracting. If they are longer, I make them dotted. But, they have to be visible, so I make the shorter ones solid. Buyers of the Brooks Trading Course and Encyclopedia of Chart Patterns have access to a much more detailed explanation of the swing trades for each day (see Online Course/BTC Daily Setups).
My goal with these charts is to present an Always In perspective. If a trader was trying to be Always In or nearly Always In a position all day, and he was not currently in the market, these entries would be logical times for him to enter.
If the risk is too big for your account, you should wait for trades with less risk or trade an alternative market like the Micro Emini.
End of day summary
The Emini gapped up and rallied above the 3,100 Big Round Number. Late in the day, it broke above the March 3 high, but sold off into the close. That is a sign that institutions are paying attention to this price. The Emini might go sideways here for several days before traders decide on a reversal down or a continuation up to the all-time high.
The odds are still against a new all-time high before there is a 15% pullback. Consecutive closes above the March 3 high will shift the probability in favor of the bulls.
The Emini is now a price level where many bulls will take profits and many bears will begin to sell. There is no top yet and there is a magnet just above. Traders expect at least slightly higher prices. But if there is enough selling around here, the Emini could retrace half of the 3 month rally.
See the weekly update for a discussion of the price action on the weekly chart and for what to expect going into next week.
Trading Room
Traders can see the end of the day bar-by-bar price action report by signing up for free at BrooksPriceAction.com. I talk about the detailed S&P Emini futures price action real-time throughout the day in the BrooksPriceAction.com trading room. We offer a 2 day free trial.
Charts use Pacific Standard Time
When I mention time, it is USA Pacific Standard Time (the Emini day session opens at 6:30 am PST, and closes at 1:15 pm PST). You can read background information on the intraday market reports on the Market Update page.
Hello Al, in your summary you say ” there is a magnet just above”. Which price level do you mean ? Thank you.
The March 3 high. Also, the close of 2019 will soon be important.
Hi Al. I found it hard to trade a bull trend day which is late in a bull trend on higher timeframe, for example today, if I look at today’s chart alone without looking weekly or monthly chart, I might have go long on the morning after seeing a few consecutive bull bars (even not very strong), but since it feels like it is going to at least have a little pullback on monthly chart, i.e. at sell zone on higher timeframe, I hesitate to go long because the reversal can happen at any time, and had to wait and seeing it goes higher without doing anything. When finally I realized today is probably going to be a bull trend day like a regular bull trend day, it is pretty much the end of the trend, and it becomes much more dangerous to go long… What is your suggestion a trading a day like this? (Btw I am more of scalping than swinging)
Forrest Gump. It is usually to best trade stupid. Just trade what is in front of you and do not worry about anything else, especially a higher or lower time frame.
It takes a while to trust the chart in front you, but it is always best to only trade that chart and ignore everything else.
Your stops will protect you from a disaster. Sometimes they will get hit, but that is part of the price of doing business, just like utility bills.
Thanks Al!
Hi Al,
I know you always suggest swing trading but I’m not sure whether I am swing trade or not. If I long/short and then sell/buy back my position after a small trend ends (eg end of wedge top/bottom). Is it regarded as a scalp? Most of the time I do not have the faith to hold the position until MM target is achieved. (Especially the target is achieved few hours later which is hard for me to hold so long time due to timezone issue)
Most swing trades become scalps with small wins or losses. Remember, only 40% will actually lead to a trend.
What is a reasonable stop loss limit, if the bear case fails? Thank you!
Everything depends on a trader’s goals. There are many variables, like the anticipated profit, the willingness to assume risk, and how long he thinks he will be in the trade.
If he is looking for a 1 – 3 day pullback, he will be quicker to get out. If he is looking for a 10 – 15% selloff, he will use a wider stop and he will be expecting to hold onto his position for 1 – 3 months. As to your question, if a trader was betting that the rally is a leg in a trading range, which it probably is, I would not be holding shorts if the rally makes a new high.
I have been talking about the March 3 high for a long time. I am a fast money trader and I sold today above the March 3 high. Since the market will probably go sideways around it for a few days, I am just looking for trades (1 – 5 days) right now. But I am also willing to buy a 3 – 5 day selloff for a trade back up if there is a selloff that looks minor.
If she closes above 3126, what is the next target?
I expect the Emini to get above it and maybe close above it, but I think the rally will not get back to the all-time high without at least a 15% pullback 1st. The next target is the old high.