Emini rally from October parabolic wedge sell climax approaching resistance
I will update again at the end of the day.
Pre-Open market analysis
Two weeks ago, I said that the October extreme sell climax would probably lead to a test of the October 17 major lower high. Yesterday came within 3 points and the bulls will try for a breakout today.
The bulls will probably get their breakout and a test of 2850 within a week or two. But, because the rally on the daily chart is extreme, there will probably then be a 1 – 2 week pullback.
Since the rally has been strong, the bears will probably need at least a micro double top before they can get a leg back down. However, the 2 week bull channel is tight. In addition, there are many bull bars closing near their highs. Consequently, the bulls will buy the 1st 2 – 3 day selloff.
Since yesterday gapped up, the bears will try to get a gap down within the next few days. That would create an island top. Because island reversals are usually minor, it would not change what will happen over the next 2 weeks. The odds are that traders will buy the 1st reversal down, even if it begins with an island top.
Overnight Emini Globex trading
The Emini is down 9 points in the Globex session. Since yesterday was a buy climax, there is a 75% chance that today will have at least 2 hours of trading range price action that starts by the end of the 2nd hour. There is only a 25% chance of another big bull trend day after a buy climax that ended at resistance.
When there is a strong bull trend, like yesterday, the chart typically has to transition into a trading range for 20 or more bars before it can reverse down into a bear trend. The trading range could last all day. Consequently, the bulls will buy any selloff on the open, even if it is surprisingly deep.
Once there is a trading range, the bears will look for a major trend reversal. Even if they create one, there is still only a 30% chance of a strong bear trend today.
Yesterday’s setups
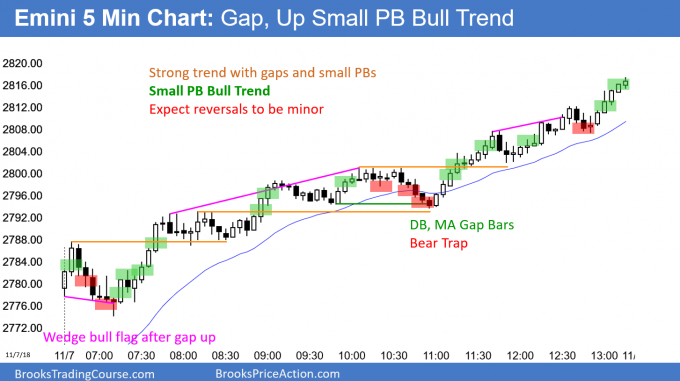
Here are several reasonable stop entry setups from yesterday. I show each buy entry with a green rectangle and each sell entry with a red rectangle. I rarely also show limit order entries and entries on the close of bars. My goal with these charts is to present an Always In perspective. If a trader was trying to be Always In or nearly Always In a position all day, and he was not currently in the market, these entries would be logical times for him to enter.
EURUSD daily Forex wedge bear flag at resistance
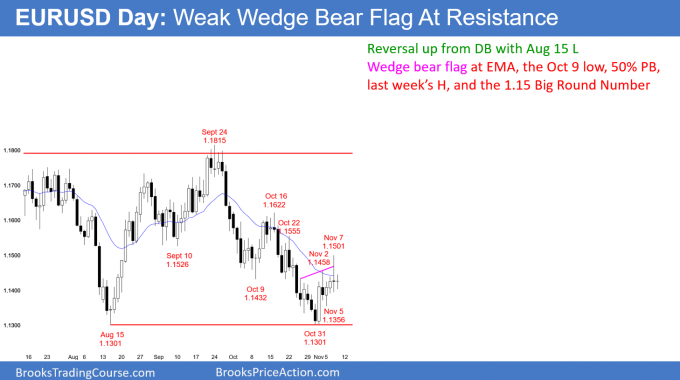
The EURUSD daily Forex chart rallied exactly 200 pips from a perfect 2 month double bottom and a wedge bottom. It is stalling at the resistance of the EMA, last week’s high, the October 9 low, the 1.15 Big Round Number, and the 50% retracement level.
I said last week that the weekly chart would rally this week above last week’s high. But, because last week was a weak buy signal bar and there was a 6 week bear micro channel on the weekly chart, I also said that the rally would stall within 1 – 2 weeks.
Although this week triggered the weekly buy signal, this week’s candlestick on the weekly chart so far has a big tail on top. Therefore, in addition to the weekly buy setup being bad, the entry bar this week so far is bad as well.
If this week closes below its open, it will be a bear bar on the weekly chart. That would make it a sell signal bar for next week. This week would be a Low 1 bear flag. However, because the 6 week selloff had mostly overlapping bars with prominent tails, the bear flag will probably not lead to a break far below the August low. More likely, if the bears get their breakout, it will probably reverse up within 2 – 3 weeks.
On the daily chart, the 6 day rally formed a wedge bear flag at the EMA. The bears need today to close near its low to create a decent sell signal bar. Yesterday is a sell signal bar, but because it was a big doji, there will probably be more buyers than sellers below its low.
The importance of this week’s close and last week’s high
The fight over the remainder of this week will be over the appearance of the weekly candlestick. The bears want a strong sell signal bar, which means a bear bar closing on its low. The bulls want the opposite. They would love the week to close on its high, but would be satisfied with a bull body and a close above last week’s high. That would increase the odds that the double bottom will have a 2nd leg up after a 2 – 3 day test down to the November 5 low next week.
Overnight EURUSD Forex trading
The EURUSD 5 minute Forex chart ha been sideways in a 40 pip range overnight. In addition, it has been sideways for 4 days. It therefore is in search of information. The most important forces magnets now are last week’s high and this week’s open. The chart will probably stay in a tight range through tomorrow, and then decide whether to close above or below last week’s high and this week’s open. Since tight trading ranges resist breaking out and the daily and weekly charts are also neutral, today and tomorrow will probably be trading range days. Day traders will look to scalp reversals.
Summary of today’s S&P Emini futures price action and what to expect tomorrow
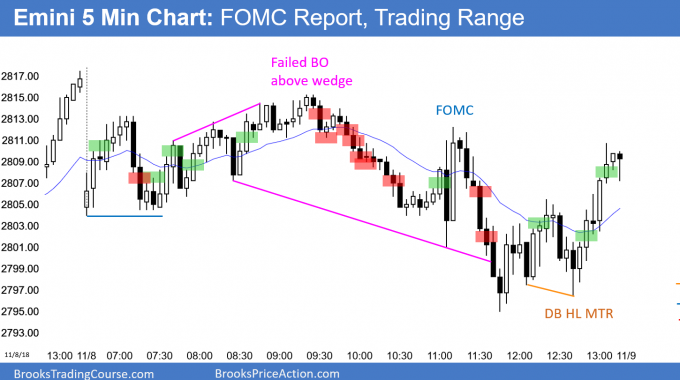
Here are several reasonable stop entry setups for today. I show each buy entry with a green rectangle and each sell entry with a red rectangle. I rarely also show limit order entries and entries on the close of bars. My goal with these charts is to present an Always In perspective. If a trader was trying to be Always In or nearly Always In a position all day, and he was not currently in the market, these entries would be logical times for him to enter.
Today’s FOMC report created some big bars and a bear channel. However, today was a bull inside day after yesterday’s buy climax. It is therefore a High 1 bull flag.
The bears see it as a sell signal bar for a double top with the October 17 high. But, the odds favor a break above the October 17 major lower high within a week. This is true even if the Emini go sideways to down for a few days first.
See the weekly update for a discussion of the price action on the weekly candlestick chart and for what to expect going into next week.
Trading Room
Traders can see the end of the day bar-by-bar price action report by signing up for free at BrooksPriceAction.com. I talk about the detailed S&P Emini futures price action real-time throughout the day in the BrooksPriceAction.com trading room. We offer a 2 day free trial.
Charts use Pacific Standard Time
When I mention time, it is USA Pacific Standard Time (the Emini day session opens at 6:30 am PST, and closes at 1:15 pm PST). You can read background information on the intraday market reports on the Intraday Market Update page.


