Emini rally stalling at resistance and from Mueller’s investigation
Updated 6:42 a.m.
The Emini broke above yesterday’s bear channel on the open and is above both the 5 and 60 minute 20 bar EMAs. Yesterday was an expanding triangle, and the bulls have a strong reversal up on the open. They hope this rally will get above last week’s high by the end of the week.
At the moment, the Emini is Always In Long. While it has not gone above yesterday’s high and is therefore still in the 2 day bear channel, this opening rally is strong. It therefore makes a bear trend unlikely. That leaves a bull trend or a trading range. Since the 60 minute chart has lost of sideways, overlapping bars with prominent tails for 2 days, traders think that the current price is about right. This reduces the odds of a strong bull trend day. However, the odds are that today will be a weak bull trend day or a trading range day.
Pre-Open market analysis
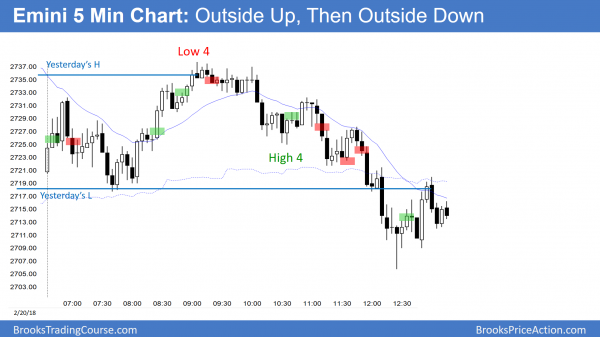
Yesterday was an outside up day and then an outside down day. The Emini is stalling around the February 7 major lower high. The bulls want a strong breakout above and then a new all-time high. The bears want a double top bear flag and a measured move down below the February low. Since Big Up, Big Down creates Big Confusion, a continued trading range is likely.
This means that both bulls and bears will continued to be disappointed by their inability to create a trend. Last week’s momentum favors the bulls. But, the rally is stalling at resistance, which is at a 50% pullback and the February 7 high. The bulls have a slight advantage after a strong rally on the daily chart and 2 strong reversals up. However, unless they can break strongly above this resistance, the odds favor a continued trading range that could last a month or more.
The bulls will probably trigger the buy signal on the weekly chart this week. They need to get above last week’s high. Anything good for the bulls is bad for the bears. Consequently, the bears will try to prevent this. They will be happy if this week remains an inside week. They then would try for a bear breakout next week below the 2 week ii (consecutive inside weeks).
The odds favor at least a little higher over the next week, but then a pullback on the daily chart. Then, the bulls will probably get at least one more leg up. The bears will try to make that leg fail, which would create a wedge lower high on the daily chart.
Overnight Emini Globex trading
The Emini is up 2 points in the Globex session. Since yesterday fell below Friday’s low, it was the 1st pullback in a 6 day bull micro channel on the daily chart. The 1st pullback usually only lasts 1 – 3 days. Consequently, the bulls will probably get at least a 1 – 2 day rally starting this week. However, this 2 day selloff might get closer to the February 14 low 1st. That was the start of the final buy climax in the 6 day rally. It is therefore a magnet.
Yesterday was both a 1st and 2nd leg down from Friday’s high on the 5 minute chart. One more push down could be the end of a 3 day wedge bull. Hence, if today falls below yesterday’s low, the bulls will look to buy a reversal up. The bears want a strong break below the February 14 low.
However, the odds are against a big selloff from a 6 day micro double top without at least a micro double top forming 1st. Therefore, this 2 day selloff will probably test back up within a few days.
Yesterday’s setups
Here are several reasonable stop entry setups from yesterday. I sometimes also show limit order entries and entries on the close of bars.
EURUSD in buy zone in bottom half of trading range
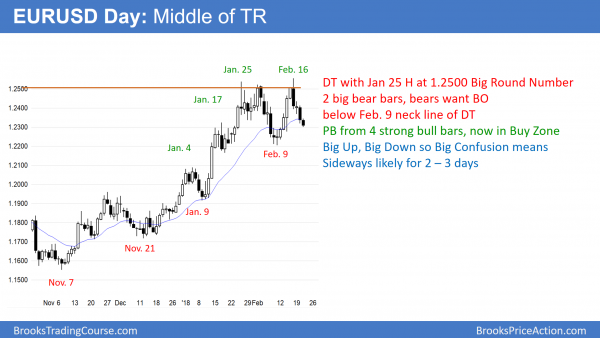
After a 6 day rally to a new high, the EURUSD daily Forex chart has reversed down for 4 days. The odds are that traders will begin to buy and the trading range will continue.
The EURUSD daily Forex chart has sold off for 4 days after reversing down from a new high above 1.2500. Since the selloff is in the bottom half of the month-long trading range, traders will begin to buy. The bears want the selloff to break below the February 9 neck line of the January 25 and February 16 double top. They then want a 300 pip measured move down to the November 9 high, which is the breakout point of the January rally.
Finally, they want the selloff to continue down to the November 7 low. That is the most recent major higher low on the weekly chart. If the bears can break below that, the bull trend on the weekly chart will have ended. The chart would then be in either a bear trend or a trading range.
However, there are many steps to this final goal and the weekly chart is still in a bull trend. Consequently, the odds are that the bears will fail to achieve their goals without the daily chart going sideways for at least another month.
This is because the weekly chart is in a strong bull trend. A strong bull trend does not typically become a bear trend until it 1st transitions into a trading range. The past 4 weeks of sideways trading is still a bull flag on the weekly chart. The bears might trade down to the 1.2000 Big Round Number within a month or two. That would close the gap above the September 8 high. Gaps usually close, and the odds are that this one will before the market can go much higher. However, it is still more likely that the daily chart will continue sideways for at least another month before selling off to close that gap. The bears probably need to build more selling pressure before they can take control.
Overnight EURUSD Forex trading
The EURUSD 5 minute Forex chart has sold off for 4 days in a tight bear channel. Tight channels usually transition into trading ranges after about 3 days. This one is therefore probably near its end. Furthermore, the EURUSD is now in the bottom half of its month-long trading range. Since trading ranges resist breakouts, the odds are that the 4 day selloff will reverse up soon rather than break below the range. Since the channel down is tight, the odds are against a strong reversal back up to the 1.25 top of the range.
More likely, the 5 minute chart will have to go sideways for a couple of days before the bulls can rally again. However, the 4 day reversal down was strong. In addition, the daily chart has now failed 3 times at 1.25. Consequently, the rally from here will probably form a lower high. Therefore, the bulls will look for only a 100 – 150 pip bounce before taking profits. The bears will probably sell above 1.24.
Summary of today’s S&P Emini futures price action and what to expect tomorrow
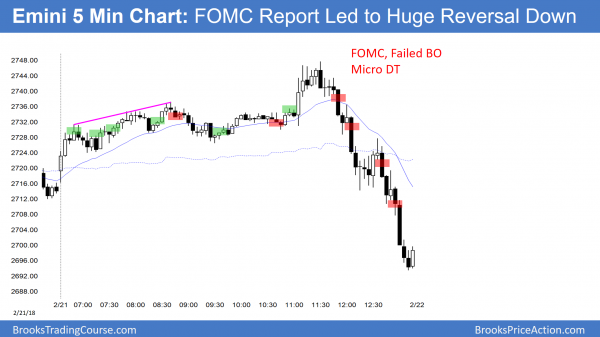
The Emini had a modest rally, but reversed down from above yesterday’s high to a new low after the FOMC announcement. It was a big outside down day.
The Emini had a weak buy signal bar yesterday on the daily chart. That meant that today was probably going to be a weak entry bar, and it was. The Emini is still in a 4 day tight trading range, despite the big outside down day today. It will probably go higher and lower over the next 2 weeks, and is deciding which will come first. Today formed a micro double top with Friday’s high. It is therefore a credible sell setup on the daily chart. Yet, the 6 consecutive bull bars make a minor reversal more likely than a bear trend.
See the weekly update for a discussion of the price action on the weekly candlestick chart and for what to expect going into next week.
Traders can see the end of the day bar-by-bar price action report by signing up for free at BrooksPriceAction.com. I talk about the detailed S&P Emini futures price action real-time throughout the day in the BrooksPriceAction.com trading room. We offer a 2 day free trial.
When I mention time, it is USA Pacific Standard Time (the Emini day session opens at 6:30 am PST, and closes at 1:15 pm PST). You can read background information on the intraday market reports on the Intraday Market Update page.


