Trading Update: Tuesday September 7, 2021
Emini pre-open market analysis
Emini daily chart
- Tight trading range for 5 days increases chance of more sideways trading despite Emini rally into Labor Day.
- Friday traded below Thursday’s low and was the 1st pullback in 6 days.
- The reversal down was from the August high and the measured move based on the height of the pandemic crash.
- Friday was a bull bar and therefore a High 1 buy signal bar for today.
- But it had a prominent tail on top and the Emini has been in a tight trading range for 5 days. This is a weak buy setup.
- Traders expect higher prices for at least another week.
- September will probably be the high of the year and it should have a bear body on the monthly chart.
- The Emini might be mostly sideway ahead of the September 22 FOMC announcement before the 2-month reversal begins. There might be a blow-off top to this 18-month rally.
Emini 5-minute chart and what to expect today
- Emini is down 2 points in the overnight Globex session.
- After 5 days in a tight trading range, there is an increased chance of another relatively small sideways day today.
- This is a Breakout Mode pattern in a buy climax. A big trend day in either direction can come at any time, but markets have inertia. They continue to do what they have been doing.
- If there is a series of strong trend bars up or down, the odds of a big trend day will go up.
Friday’s Emini setups

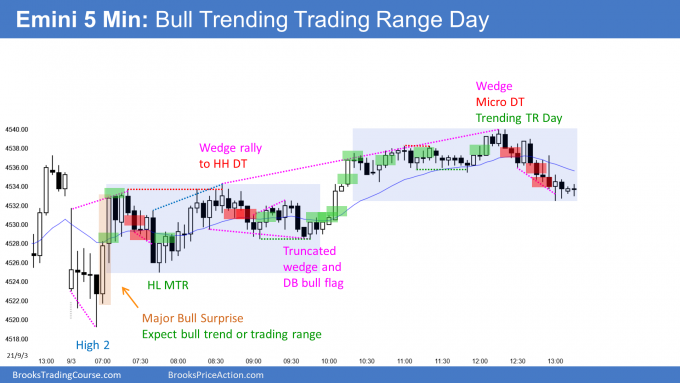
Here are several reasonable stop entry setups from last Friday (before Monday’s holiday). I show each buy entry with a green rectangle and each sell entry with a red rectangle. Buyers of both the Brooks Trading Course and Encyclopedia of Chart Patterns have access to a much more detailed explanation of the swing trades for each day (see Online Course/BTC Daily Setups).
My goal with these charts is to present an Always In perspective. If a trader was trying to be Always In or nearly Always In a position all day, and he was not currently in the market, these entries would be logical times for him to enter. These therefore are swing entries.
It is important to understand that most swing setups do not lead to swing trades. As soon as traders are disappointed, many exit. Those who exit prefer to get out with a small profit (scalp), but often have to exit with a small loss.
If the risk is too big for your account, you should wait for trades with less risk or trade an alternative market like the Micro Emini.
EURUSD Forex market trading strategies
EURUSD Forex daily chart

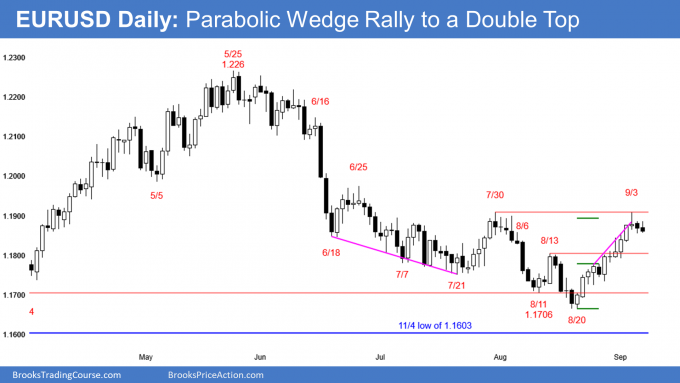
- Strong rally to a fraction of a pip above the July 30 high.
- The bulls want the rally to continue to above the June 25 lower high.
- Unless they get consecutive closes above the July 30 high, there should be a pullback over the next week. It could be sideways or down.
- Yesterday was a bear day and today so far is a bear day. If it remains a bear day, there will probably be a couple small legs down to below the August 13 high over the next couple of weeks.
- There have been 3 pushes up in the bull channel from the August 20 low. That is a parabolic wedge buy climax, and it often will attract profit taking. Increased chance of a pullback this week.
- The bears want a reversal down from a buy climax and a double top. They then want a breakout below the August 20 neckline of the double top and a measured move down.
- It is more likely that a reversal down will be minor and form a higher low at around a 50% pullback and the July 21 low.
Summary of today’s S&P Emini futures price action and what to expect tomorrow

End of day summary
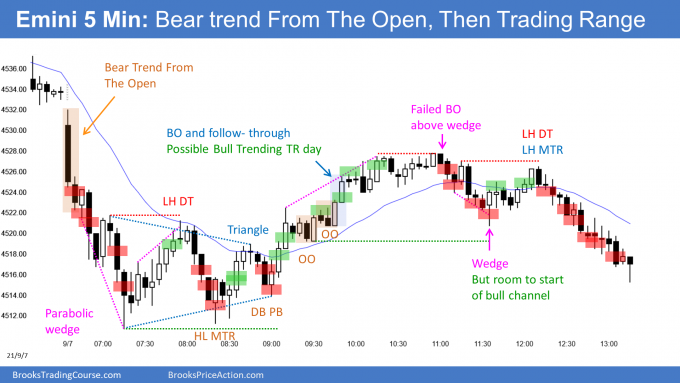
- Parabolic wedge sell climax on the open.
- Reversed up from just below 6-day tight trading range and exactly at last week’s low.
- Rally stalled at 60-minute EMA and evolved into upper trading range in trending trading range day.
- Every day in September has traded through the open of the month, which should remind traders that the open is important.
- There have never been 8 consecutive bull bars on the monthly Emini chart. September or October should be the high of the year, and there should then be a 15 to 20% pullback.
See the weekly update for a discussion of the price action on the weekly chart and for what to expect going into next week.
Trading Room
Traders can see the end of the day bar-by-bar price action report by signing up for free at BrooksPriceAction.com. I talk about the detailed S&P Emini futures price action real-time throughout the day in the BrooksPriceAction.com trading room. We offer a 2 day free trial.
Charts use Pacific Time
When I mention time, it is USA Pacific Time. The Emini day session charts begin at 6:30 am PT and end at 1:15 pm PT which is 15 minutes after the NYSE closes. You can read background information on the market reports on the Market Update page.
Hi Dr. Brooks,
I took the short below Bar 20 for a scalp profit, but I wasn’t very confident in my trade because 9 to 17 was tight with small pullbacks. Although the trade worked, I was unsure of myself because I was afraid of selling into a tight bull channel because possible buyers below. Can you help explain why I shouldn’t be afraid of taking shorts into the 9 to17 Bull Move?
Similarly, I took a long trade at Bar 67, which is stupid in hindsight because we’re reversing down from Bar 54 to 61 in a tight channel so probably sellers above. But I tried to justify the trade because the Bull Move from 9 to 17 was tight but a short into it worked. It’s confusing me because the first scenario, a tight channel is not respected, and the second scenario a tight channel is respected.
Sorry for the long post, thank you Dr. Brooks.
Hi Al,
Is there any practical significance that today we didn’t have a breakout of the 18 Bar range? What does a day without a breakout of the 18 Bar range signify?
I would not worry about it. That is fairly common when there is a strong trend on the open and then a reversal. Most of those days do not break out of the 18-bar range.
Thanks for the answer.