Trading Update: Tuesday June 22, 2021
Emini pre-open market analysis
Emini daily chart
- Yesterday opened near Friday’s open with the Emini rallying from bear trap. A bull day after a big bear day where there is very little overlap between the 2 days is bullish.
- Many of Friday’s sellers did not exit today. If they exit this week, their short covering could lead to a new high.
- Yesterday’s low was another test of the 50-day MA and the May 14 high. That high was the neckline for the May 12/May 19 double bottom.
- There are 6 trading days left in June. The bulls want the Emini to close above the open of the month so that June will have a bull body on the monthly chart.
- If June has a bear body, it will be a sell signal bar for a parabolic wedge buy climax on the monthly chart.
- I have mentioned several times that the stock market tends to rally going into the 4th of July. The most reliable start of the rally is June 26. It is possible that the late June rally began today. If the bulls get follow-through buying, then the Emini will probably make a new high within the next 2 weeks.
- Can today be a bull trap? Any rally can be a bull trap. If the Emini sells off strongly this week, there would be a head and shoulders top on the daily chart, where the May 7 high would be the left shoulder.
- It is important to note that any top has only a 40% chance of leading to a bear trend. Therefore, it is more likely that any reversal down this week will simply be a bear leg in the 3-month trading range.
- Because the Emini has been in a trading range, traders expect reversals.
- The bears wanted Friday to lead to a bear breakout. The bulls want today to lead to a bull breakout and for last week’s selloff to be a late June bear trap.
- But until there is a breakout, traders will continue to expect disappointing follow-through after strong moves up and down and then another reversal.
- The strong 16-month rally and yesterday’s strong reversal up make a successful bull breakout slightly more likely than a bear breakout. If the bulls get a good 2nd consecutive strong bull day tomorrow, there will probably be a new high soon.
Emini 5-minute chart and what to expect today
- Emini is down 2 points in the overnight Globex session.
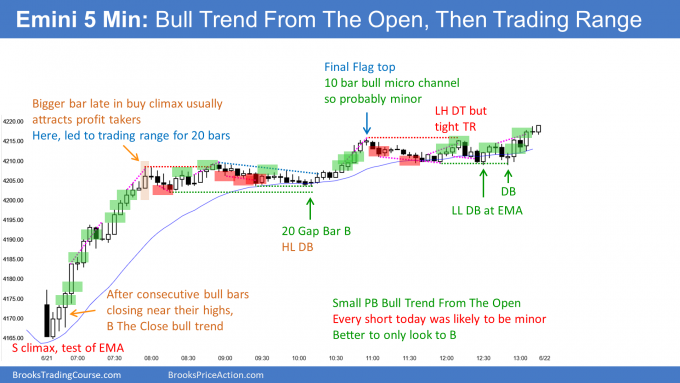
- Yesterday was a buy climax day. Today therefore has at least a 75% chance of going sideways to down for at least a couple hours, starting by the end of the 2nd hour. It might get stuck in the trading range that set up after the first 90 minutes yesterday.
- Even if today is mostly sideways, it should have at least one swing up and one swing down.
- There is only a 25% chance that today will be a 2nd consecutive big bull day or big bear day.
- While more trading range trading is likely, if there is a series of strong trend bars in either direction in the 1st hour, there will be an increased chance of a strong trend day.
Yesterday’s Emini setups

Here are several reasonable stop entry setups from yesterday. I show each buy entry with a green rectangle and each sell entry with a red rectangle. Buyers of both the Brooks Trading Course and Encyclopedia of Chart Patterns have access to a much more detailed explanation of the swing trades for each day (see Online Course/BTC Daily Setups).
My goal with these charts is to present an Always In perspective. If a trader was trying to be Always In or nearly Always In a position all day, and he was not currently in the market, these entries would be logical times for him to enter.
If the risk is too big for your account, you should wait for trades with less risk or trade an alternative market like the Micro Emini.
EURUSD Forex market trading strategies
EURUSD Forex daily chart

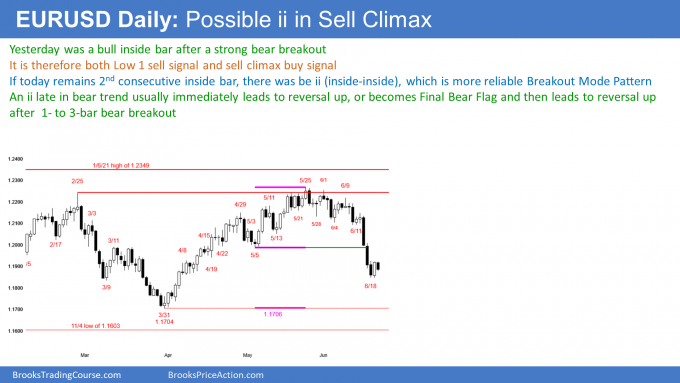
- After 3 big bear bars and with the EURUSD still in an 11-month trading range, yesterday was not likely to be a big bear day. Instead, it was a big bull day.
- Yesterday’s high was below Friday’s high and its low was above Friday’s low. Yesterday was therefore a bull inside bar.
- That is a Breakout Mode setup. It is both a buy and sell signal bar for today.
- Since it was a bull bar in a sell climax, it is a weak Low 1 sell signal bar. There will probably be buyers not far below its low.
- For the bulls, they want the 3-day selloff to be a bear trap and a failed breakout below the May 5 bottom of a 2-month trading range.
- So far, today is inside of yesterday’s range. If it remains an inside day, there will be consecutive inside bars (ii), which is a more reliable Breakout Mode Pattern.
- An ii late in a bear trend usually either leads to a reversal up or it becomes a Final Bear Flag. That means if there is a bear breakout, it typically fails and the EURUSD reverses up within a few days.
- Since the 3 bear bars were surprisingly big, the 1st reversal up will probably be minor, even if it gets back above the bottom of the range at the May 5 low.
- Since the EURUSD has been in a trading range for 11 months, traders should expect disappointment. Consequently, the rally might go above the May 5 low without 1st forming a micro double bottom. This would disappoint the bears who want a bear trend.
- Whether or not it does, the bulls will probably need at least a small double bottom before they can get much above the June 16 sell climax high. The start of a sell climax is always a magnet when there is a reversal up.
- The EURUSD will probably be sideways to up for at least a couple days and possibly for a couple weeks.
- Last week’s selloff was so strong that traders expect at least a small 2nd leg sideways to down before there is a rally above the May high.
- There is a 30% chance that this will be a V-bottom and that the EURUSD will go straight up to above the June 16 high in June.
EURUSD Forex trading on 5-minute chart
- Today reversed down from below yesterday’s high. So far, it is above yesterday’s low. It is therefore a 2nd consecutive inside day.
- Today will probably not break far above or below yesterday’s range so today will likely not be a trend day.
- Day traders so far today have been scalping in both directions
- If it remains a 2nd inside day, the bulls will try to get it to close near the high. That would increase the chance of a rally over the next few days.
- The bears will try to get it to close near its low, increasing the chance of a bear breakout. However, the bears know that if today remains an inside day and there is a bear breakout, there will probably be a reversal up within a few days.
Summary of today’s S&P Emini futures price action and what to expect tomorrow

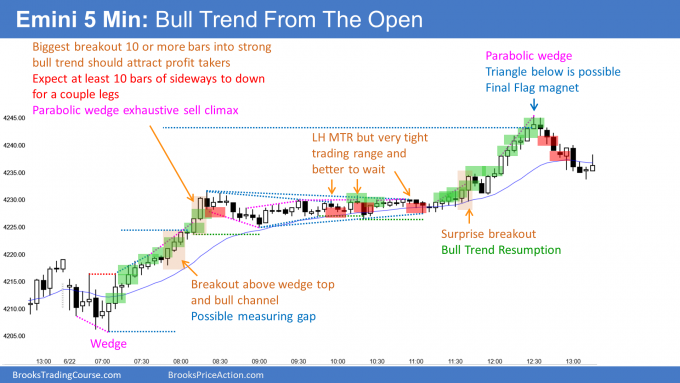
Here are several reasonable stop entry setups for today. I show each buy entry with a green rectangle and each sell entry with a red rectangle. Buyers of both the Brooks Trading Course and Encyclopedia of Chart Patterns have access to a much more detailed explanation of the swing trades for each day (see Online Course/BTC Daily Setups).
My goal with these charts is to present an Always In perspective. If a trader was trying to be Always In or nearly Always In a position all day, and he was not currently in the market, these entries would be logical times for him to enter.
If the risk is too big for your account, you should wait for trades with less risk or trade an alternative market like the Micro Emini.
End of day summary
- Rallied from small wedge bottom. There was also an Expanding Triangle bottom that began in the middle of yesterday.
- After a weak rally for an hour, the Emini broke out strongly.
- Parabolic wedge top where the 3rd leg up was 2 unusually big bull bars. This exhaustion attracted profit takers and the Emini transitioned into a trading range for 3 hours.
- Strong trend resumption up at end of day.
- Very strong 2-day rally. Even though still in 2-month trading range, odds favor new all-time high this month.
- Bulls want 200-point measured move up based on height of 3-month trading range. Since seasonally bullish and unexpectedly strong 2-day rally, 40% chance rally could reach measured move target within a few weeks.
- 2 big bull days so might get pullback tomorrow, but probably would only last a day or two. Odds favor higher prices.
See the weekly update for a discussion of the price action on the weekly chart and for what to expect going into next week.
Trading Room
Traders can see the end of the day bar-by-bar price action report by signing up for free at BrooksPriceAction.com. I talk about the detailed S&P Emini futures price action real-time throughout the day in the BrooksPriceAction.com trading room. We offer a 2 day free trial.
Charts use Pacific Time
When I mention time, it is USA Pacific Time (the Emini day session opens at 6:30 am PT, and closes at 1:15 pm PT). You can read background information on the market reports on the Market Update page.
Emini. Last week’s Emini weekly was bar 6 that closed (weekly time frame the highest noticeable time frame) below the 16 month bull trend line.
Would you conclude a successful breakout below the 16 month bull trend line and conclude the 16 month bull channel is over or less important than the 7 month bull channel that began in November 2020?
Kindly requesting your analysis if the 16 month bull channel lines are no longer important (now irrelevant) magnets than the 7 month (less steep) bull channel lines?
Thank you if you have time to clarify,
This question is better for a weekend blog when I show the weekly chart. However, most breaks below a bull trend line fail. Most breakouts of anything fail.
Remember my 80% rule from the Course. Markets have inertia, and 80% of the attempts to change what the market is doing will fail.
When a market reverses around a trend line, traders the draw a new trend line. When there is a reversal up from a bull trend line, the bull channel typically becomes a flatter, broader, and weaker.
The odds that a breakout below anything will succeed are higher if the breakout bar is big and it closes near its low and far below the breakout point. Additionally, it will more likely succeed if the follow-through bar closes in the same direction and near its low, and if it is also a big bar. None of this is present on the weekly chart.
Mostly the sell off that happens on a strong bull trend ends as a flag or climatic and the bull re-enter and market moves higher.
Will there be traders and institutions who will be only buyers waiting for the sell off to end or scale in without participating on the temporary swing down?
In a strong trend, there are more buyers than sellers, and the buyers are buying for any reason.
Some will buy at the market, even at the high. Many of these buyers will use a wide stop and scale in lower.
When a trend has gone on for a long time, traders know there will soon be profit taking, which means a pullback. Some traders prefer to only buy pullbacks.
There are many ways to structure a reasonable trade in a trend. Each trader has his or her favorite way to trade. It all can be profitable when structured logically.