Emini now in sell zone at resistance of the February low
I will update again at the end of the day.
Pre-Open market analysis
Yesterday rallied strongly on the open to close back above the February low. Back on December 24 at the bear low, I said this was likely to happen. But, I said that the February low was the bottom of a resistance zone, and the rally would probably fail around 2,600. That is still likely.
With the strong rally, traders are now wondering if the low is in. There is a 60% chance that we will test the December low before going above the September high. However, the bear rally does not have a top yet. In addition, the October low and the December 12 minor lower high are magnets above.
Overnight Emini Globex trading
The Emini is up 16 points in the Globex session. It has rallied for the past 2 days and for 5 of the past 7 days. But, there is resistance above at the October low at around 2,600. The 2018 trading range is resistance and this rally is now in that sell zone. However, there is support below at the February low.
Despite the 2 week rally, most of the trading over the past week has been in tight trading ranges. Consequently, the odds are that today will also spend a lot of time going sideways.
The 2 week rally is probably a bull leg in what will become a 1 – 2 month trading range. The tops and bottoms of trading ranges are rarely clear as they are forming. In addition, breakouts and reversals often come at times when they appear unlikely. Traders need to be ready for anything. However, the daily ranges have been big and there has been at least one swing trade every day.
Yesterday’s setups

EURUSD Forex reversal down from top of 2 month trading range, but might be pullback

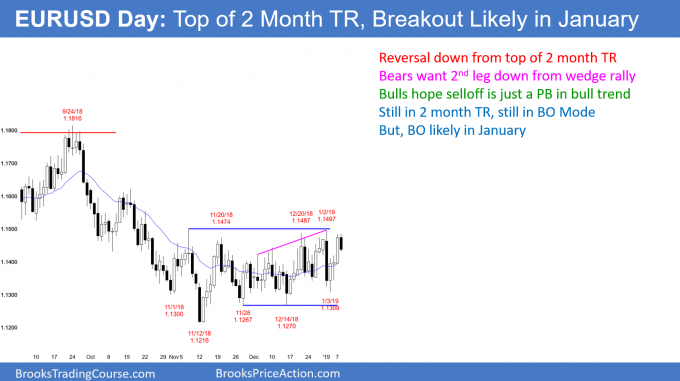
The EURUSD daily Forex chart has been in a trading range for 2 months. There have been many strong legs up and down. But, since the chart is in a trading range, traders bet that every strong move will reverse within a few days. The bulls take profits and the bears sell near the top. The bears take profits and the bulls buy near the bottom. This creates is a series of reversals.
Since every trading range over the past year broke out by around 2 months, this trading range will likely end this month. It is a mistake to assume that the bulls have an advantage. A chart could not remain in a range is one side was stronger. Until there is a breakout, there is no breakout. However, the build up of tension will likely create a breakout soon. In the meantime, traders make more money betting on reversals.
Overnight EURUSD Forex trading
After a 3 day rally to the top of the 2 month trading range, the EURUSD 5 minute Forex chart sold off 50 pips overnight. The selloff over the past 2 hours was in a tight bear channel. Consequently, traders will sell the 1st 20 pip bounce today. The bulls will probably need at least a small double bottom before they can get back to the overnight high.
After 3 strong days up, the bears will probably not be able to drive the market down much further today. Yesterday was a big bull day. The breakout point was Friday’s high of 1.1419. That is a reasonable target for the bears today. But it is only 14 pips below the overnight low.
With limits on the bulls and bears today, today will probably be in a 50 pip range. Day traders will scalp. Since a breakout of the 2 month range will probably start this month, day traders will be quick to swing trade once the breakout is clear.
Summary of today’s S&P Emini futures price action and what to expect tomorrow

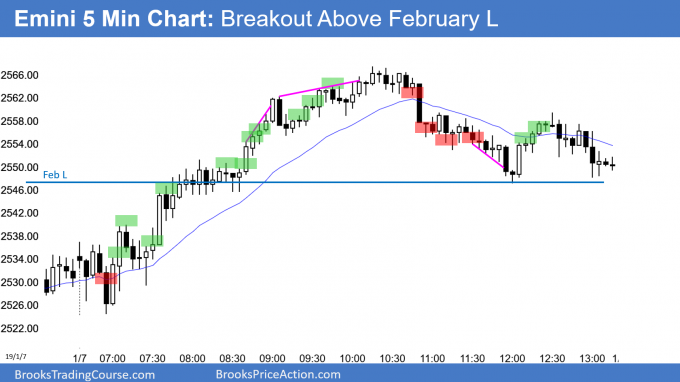
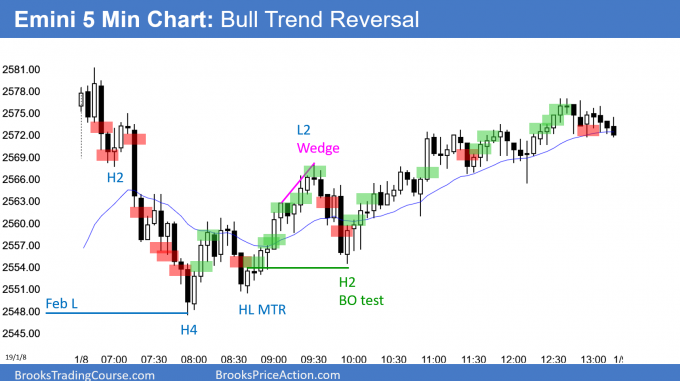
Here are several reasonable stop entry setups for today. I show each buy entry with a green rectangle and each sell entry with a red rectangle. I rarely also show limit order entries and entries on the close of bars. My goal with these charts is to present an Always In perspective. If a trader was trying to be Always In or nearly Always In a position all day, and he was not currently in the market, these entries would be logical times for him to enter.
The Emini gapped up, but sold off on the open to the February low. It reversed up there again, as it did yesterday. Today was a bull reversal day. But, like most reversal days, it was also mostly a trading range day. It failed to make a new high and it closed below the open.
The Emini is now in the sell zone on the daily chart. Today is a Low 2 sell signal bar for tomorrow. However, the 2 week bull channel is tight. Consequently, there might be more buyers than sellers below.
Since most of the trading over the past week has been sideways, that is likely again tomorrow. Today’s bull channel is a bear flag. Therefore, tomorrow will probably break below today’s bull channel. In addition, tomorrow might fall below today’s low and trigger a Low 2 sell signal.
See the weekly update for a discussion of the price action on the weekly candlestick chart and for what to expect going into next week.
Trading Room
Traders can see the end of the day bar-by-bar price action report by signing up for free at BrooksPriceAction.com. I talk about the detailed S&P Emini futures price action real-time throughout the day in the BrooksPriceAction.com trading room. We offer a 2 day free trial.
Charts use Pacific Standard Time
When I mention time, it is USA Pacific Standard Time (the Emini day session opens at 6:30 am PST, and closes at 1:15 pm PST). You can read background information on the intraday market reports on the Intraday Market Update page.
Hi Al why would you not sell 25 as sell the close?
thx
After consecutive bottoms, a MTR was likely, and and HL was more likely than a LL. Therefore, the odds were that 25 was a test that was going to fail.
Hi Al, for the sell below #3, if one has to pick the top 2 reasons to sell there what should them be? #3 is a big bull bar so it made me suspect there may not a lot of sellers below.
Failed breakout above yesterday’s high.
2nd sell signal.
2 was the neck line of the micro double top.
I have the same issue, it’s not just you, Len.
Also noticed that Al’s profile picture suddenly changed to the older one. Not sure if it’s at all related.
Hi Jakub,
See my reply to Len on images. And thanks for picking up Al’s image oddity. Not directly related to post image, but obviously something to do with major system update. Will check it out.
Al,
I usually click on the charts that you post and the chart enlarges and allows for printing so I can compare your entries with mine. Yesterday and today the chart does not allow for an image to enlarge and print. Is this a problem at my end or have the charts been posted differently.
Thank you in advance
Hi Len, Jakub,
The website had a major update over the weekend with a new visual editor. Settings placements are quite different and image link setting was missed.
Done now on all image, so please check Ok. Should be fine.