Emini and Forex Trading Update:
Tuesday March 3, 2020
I will update again at the end of the day.
Pre-Open market analysis
As I said was likely, yesterday was a bull trend day. Since last week’s collapse was so severe, there will probably be more short covering today or later this week. However, there is currently only a 30% chance that this rally will be a repeat of the January 2019 reversal. That rally went straight up for 4 months with only small pullbacks.
If there is surprisingly bad news about coronavirus, the bears will get another leg down. There is still a 30% chance of a 30 – 50% correction.
However, there were no significant surprises for a few days. Traders are wondering if they drove the market down further than necessary to compensate for the coronavirus.
When there is uncertainty, the market usually goes sideways. While there is a bullish bias this week, traders want at least a few weeks without terrible coronavirus news before they will chase a rally to a new high.
That is not likely to happen for at least a month or two. It will only happen if the pandemic is contained. Since I think that is unlikely, I suspect a new high is many months away.
Overnight Emini Globex trading
The Emini is up 12 points in the Globex session. After an extreme buy climax day like yesterday, there is only a 25% chance of another strong bull trend day lasting all day.
Furthermore, there is a 75% chance of at least a couple hours of sideways to down trading starting by the end of the 2nd hour.
Yesterday spent several hours in a trading range just above the 3000 Big Round Number and the 60 minute EMA. Both are magnets below for today and tomorrow.
The Emini has been in a tight trading range overnight. There is an increased chance of a lot of trading range price action after a huge trend day. The overnight range might continue all day. If there is a bear breakout, a measured move down would be in yesterday’s range just above 3000.
Yesterday’s setups

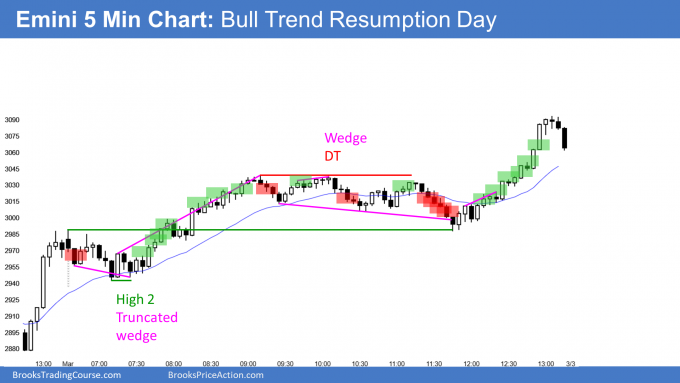
Here are several reasonable stop entry setups from yesterday. I show each buy entry with a green rectangle and each sell entry with a red rectangle. I rarely also show limit order entries and entries on the close of bars. Buyers of the Brooks Trading Course and Encyclopedia of Chart Patterns have access to a much more detailed explanation of the swing trades for each day.
My goal with these charts is to present an Always In perspective. If a trader was trying to be Always In or nearly Always In a position all day, and he was not currently in the market, these entries would be logical times for him to enter.
If the risk is too big for your account, you should wait for trades with less risk or trade an alternative market like the Micro Emini.
EURUSD Forex market trading strategies

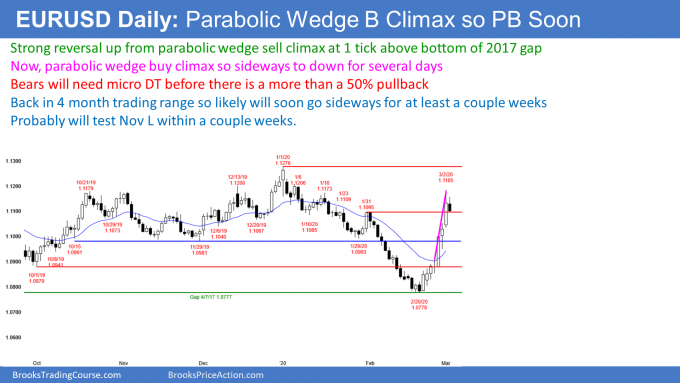
The daily chart of the EURUSD Forex market had an exceptionally strong rally up from the 2017 gap. The rally has had 3 legs in a bull micro channel. This is a parabolic wedge buy climax, which typically attracts profit taking.
Traders should expect several days down to around the November low and a 50% pullback over the next week or so. However, the bears will probably need at least a micro double top before they have a reasonable chance of a test of the February low.
There may be one more brief push up before the profit taking begins. For example, if today’s high remains below yesterday’s high, which is likely, today will be a pullback. It would then be a High 1 bull flag buy signal bar for tomorrow. If it has a bear body, it would be a weak buy setup. There would probably be more sellers than buyers above its high. That reversal down would create a micro double top with yesterday’s high and could begin a 50% pullback.
Overnight EURUSD Forex trading
The 5 minute chart of the EURUSD Forex market drifted down in a bear trending trading range day so far today. The bulls would like a test of yesterday’s high. At a minimum, they want today to close above the open. Today would then have a bull body on the daily chart. That would make it a higher probability High 1 buy signal bar for tomorrow.
However, since yesterday might have begun some profit taking, there might not be much buying today. That reduces the chance of a strong bull day.
A strong rally typically needs a day or two of sideways trading before the bears can create a strong selloff. That therefore lowers the chance of a big bear day today.
A bear trending trading range means there was a trading range, a bear breakout, and another trading range. Most of the overnight trading was within trading ranges. That increases the chance of quiet trading today. Day traders are looking for reversals to scalp for 10 – 20 pips. A strong breakout up or down would be a surprise.
Summary of today’s S&P Emini futures price action and what to expect tomorrow

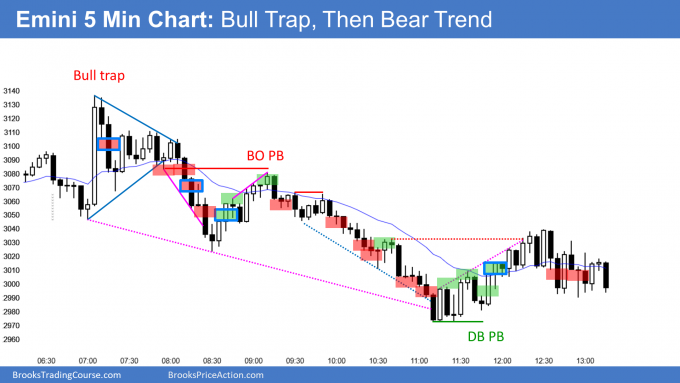
Here are several reasonable stop entry setups for today. I show each buy entry with a green rectangle and each sell entry with a red rectangle. I rarely also show limit order entries and entries on the close of bars. Buyers of the Brooks Trading Course and Encyclopedia of Chart Patterns have access to a much more detailed explanation of the swing trades for each day.
My goal with these charts is to present an Always In perspective. If a trader was trying to be Always In or nearly Always In a position all day, and he was not currently in the market, these entries would be logical times for him to enter.
If the risk is too big for your account, you should wait for trades with less risk or trade an alternative market like the Micro Emini.
End of day summary
The Emini rallied briefly on the Fed rate cut, but the rally was a bull trap. It sold off for the rest of the day. The bottom was about a measured move down based on the height of the huge bull breakout bar.
As big as the selloff was, it was only a 50% retracement of the 3 day rally. The Emini is still likely to go sideways more after such last week’s huge selloff.
Traders need more information. They expect more coronavirus cases until there is a vaccine next year. But if the number of cases accelerates, the odds of a 30 – 50% correction will go up from the current 30% probability.
See the weekly update for a discussion of the price action on the weekly chart and for what to expect going into next week.
Trading Room
Traders can see the end of the day bar-by-bar price action report by signing up for free at BrooksPriceAction.com. I talk about the detailed S&P Emini futures price action real-time throughout the day in the BrooksPriceAction.com trading room. We offer a 2 day free trial.
Charts use Pacific Standard Time
When I mention time, it is USA Pacific Standard Time (the Emini day session opens at 6:30 am PST, and closes at 1:15 pm PST). You can read background information on the intraday market reports on the Market Update page.
Hi Al
Do you think the market reaction like this after a rate cut is a bearish signal? Seems traders are not having a good expectation on the economic outlook.
Is the bull trap already the 50% up after first bear leg?
Yes, I talked about that in the room and I believe I wrote about it. However, the only thing that matters now is coronavirus news.
I said in December that the market was going down because the break above the 13 year bull channel was likely to fail.
This was before the coronavirus. The coronavirus is causing the current big swings, but the technical picture said that we were going down regardless. The bad reaction to the rate cut is evidence that there are fundamental problems that the charts revealed, in addition to the short-term coronavirus problem.