Emini and Forex Trading Update:
Monday March 2, 2020
I will update again at the end of the day.
Pre-Open market analysis
The Emini collapsed last week. It is now down in the March to October trading range. Traders looked at that as a fair price. They probably will again. Consequently, the Emini might begin to go sideways this week. It could be sideways for a month or more. That is what often happens after a very big move.
When there is a huge selloff like last week, the bears have big profits. Also, their stops are now far above. That means their risk is getting too big. They can reduce their risk by buying back (covering) some of their shorts.
Traders should expect a strong short covering rally to begin today or tomorrow. Friday is a good buy signal bar for today. However, the 1st reversal up will form a lower high. This is true even if it is very strong and lasts several days.
February was a huge outside down bar on the monthly chart. It is therefore a monthly sell signal. March will probably trigger the sell signal by trading below the February low at some point. If you read my weekend blog, you know that there is a potentially huge problem with the coronavirus.
However, when there is a very big outside bar, there is an increased chance that the next bar will be an inside bar. If today opens above Friday’s low, there might an early rally as the bulls try to create an inside bar in March.
Did the market fully adjust for coronavirus?
Traders are deciding if they have fully priced in the consequences of the corona virus. If the rate of new cases slows this week, traders will wonder if worldwide containment will be successful and it they lowered the price too much. That could result in a big rally over the next week or two. But probably not to a new high.
After a Bear Major Surprise, the best the bulls typically can get is a bull leg in a trading range. Then, after 20 or more bars, if they can create some type of a double bottom or wedge bottom, they would have a better chance of resuming the bull trend.
However, if there is a steady increase in the number of new cases, and especially if here is a dramatic increase, the odds of a 30 – 50% correction will go up. There is currently only a 30% chance.
Most likely, the news will become less bearish and the Emini will be sideways over the next month. With it as oversold as it is, no news should result in a rally, maybe starting today.
Overnight Emini Globex trading
The Emini rallied strongly overnight but then fell back. Much of the price action is being driven by coronavirus news. There was an increase in cases in the US overnight.
But as long as the news is not terrible, the Emini will begin to enter a trading range. Traders suspect that last week might have adequately repriced the market. The bulls therefore are willing to begin to buy and the bears will start to take profits if the news stabilizes. Both expect a trading range once they feel that containment might be successful.
The daily ranges and the bars on the 5 minute chart have been huge. Unless a day trader has at least a $50,000 account, he should probably not be trading Emini contracts until the ranges become much smaller.
One alternative is to trade micro Emini contracts. They have only 10% of the value of Emini contracts. If the daily range is 10 times bigger than normal, trading a single micro Emini is comparable to trading one Emini contract during normal market conditions. Day traders can also trade big volume stocks or options as alternatives.
Since the overnight news was not terrible and the Emini traded mostly sideways Friday, day traders expect legs up and down again today. There is an increased chance of one or more big bull trend days starting early this week.
Friday’s setups

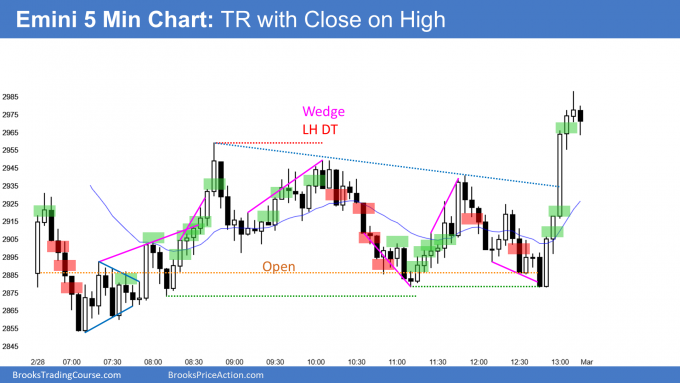
Here are several reasonable stop entry setups from Friday. I show each buy entry with a green rectangle and each sell entry with a red rectangle. I rarely also show limit order entries and entries on the close of bars. Buyers of the Brooks Trading Course and Encyclopedia of Chart Patterns have access to a much more detailed explanation of the swing trades for each day.
My goal with these charts is to present an Always In perspective. If a trader was trying to be Always In or nearly Always In a position all day, and he was not currently in the market, these entries would be logical times for him to enter.
If the risk is too big for your account, you should wait for trades with less risk or trade an alternative market like the Micro Emini.
EURUSD Forex market trading strategies

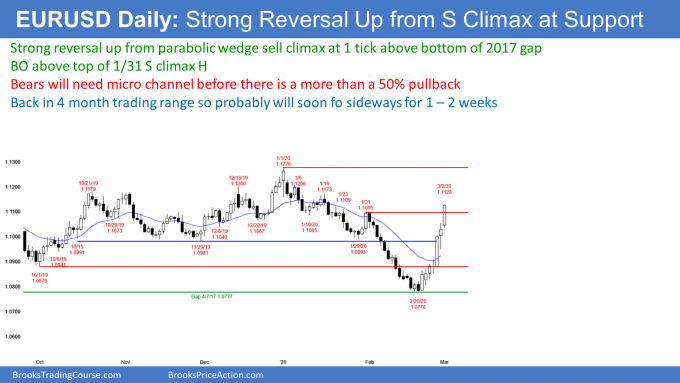
The daily chart of the EURUSD Forex market fell to within 1 pip of closing a gap from 2017 last week. It reversed up violently and is back in the 4 month trading range from late last year. Since traders thought that this area was a fair price for a long time, they will probably again think it is fair. Traders should expect the rally to stall this week and begin to go sideways.
The rally is a Bull Surprise. A surprise means a low probability event. Consequently, many traders are positioned incorrectly. The bulls who missed the rally are eager to buy a dip. Also, many bears failed to exit near the low. They want a pullback so that they can buy back their shorts with a smaller loss.
With lots of bulls and bears looking to buy a pullback, the 1st reversal down will be minor. This is true even if it lasts a couple weeks, retraces more than half of the rally, and again dips below the October low.
Monthly buy signal
The 5 minute chart of the EURUSD Forex market rallies strongly last night to above last month’s high. On the monthly chart, February closed above its midpoint and therefore is a buy signal bar. The overnight rally triggerd the monthly buy signal.
Since February had a bear body and its high was in the middle of a 7 month tight trading range, it is a weak buy signal bar. Therefore, there will probably be sellers somewhere above its high. It is more likely that the EURUSD will go sideways for the next month than up above the January high. However, if it breaks strongly above the January high, traders will conclude that the 2 year bear trend has finally ended.
Overnight EURUSD Forex trading
The EURUSD 5 minute chart has been rallying in a tight bull channel overnight. A big bull trend makes a bear trend unlikely today.
The rally went above last month’s high and above the sell climax high on the daily chart. Also, it has been extreme and will soon attract profit takers.
There might not be much incentive for today’s huge bull today to continue much higher today. Therefore, traders will probably begin to take some profits. Once they do, the strong bull trend on the 5 minute chart will evolve into a trading range.
When it does, bear day traders will begin to scalp. They want to see at least one 30 pip pullback before shorting. And even when they do short, they will look for only 10 – 20 pip scalps.
At the moment, day traders are only buying, mostly for swing trades. As the momentum slows, they will begin to switch to scalping. Even once the EURUSD enters a trading range today, it will still probably be easier to make money buying pullbacks than selling rallies.
Summary of today’s S&P Emini futures price action and what to expect tomorrow

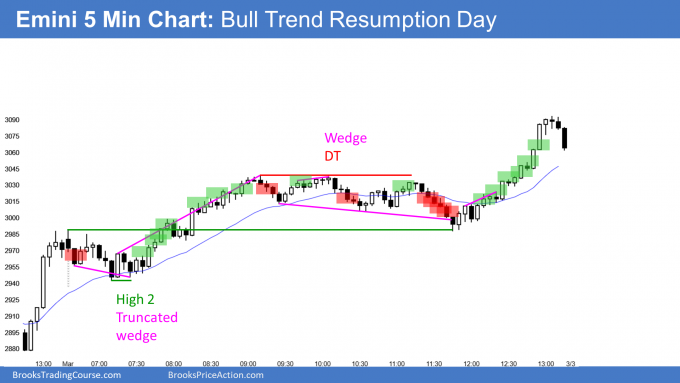
Here are several reasonable stop entry setups for today. I show each buy entry with a green rectangle and each sell entry with a red rectangle. I rarely also show limit order entries and entries on the close of bars. Buyers of the Brooks Trading Course and Encyclopedia of Chart Patterns have access to a much more detailed explanation of the swing trades for each day.
My goal with these charts is to present an Always In perspective. If a trader was trying to be Always In or nearly Always In a position all day, and he was not currently in the market, these entries would be logical times for him to enter.
If the risk is too big for your account, you should wait for trades with less risk or trade an alternative market like the Micro Emini.
End of day summary
As was likely, the Emini rallied today. The initial rally stalled near the 60 minute EMA and the Emini entered a trading range for the middle of the day. The bulls got trend resumption up at the end of the day.
With today’s huge rally and close near the high, the Emini will probably be higher tomorrow. If it gaps up, there will be a 3 day island bottom. However, island tops and bottoms are minor patterns.
As strong as the rally was, the Emini might be sideways for a month or more. Traders will remain afraid of more bad news about the coronavirus for at least several more weeks. Consequently, any rally will probably only be a leg in a trading range and not a resumption of last year’s bull trend.
Because the bears are exhausted, the downside will probably be limited for a week or two unless there is surprisingly bad news about coronavirus. Traders expect higher prices either tomorrow or Wednesday.
See the weekly update for a discussion of the price action on the weekly chart and for what to expect going into next week.
Trading Room
Traders can see the end of the day bar-by-bar price action report by signing up for free at BrooksPriceAction.com. I talk about the detailed S&P Emini futures price action real-time throughout the day in the BrooksPriceAction.com trading room. We offer a 2 day free trial.
Charts use Pacific Standard Time
When I mention time, it is USA Pacific Standard Time (the Emini day session opens at 6:30 am PST, and closes at 1:15 pm PST). You can read background information on the intraday market reports on the Market Update page.
Hi Al,
on the daily chart: would you say the Emini is always in long?
Thanks for all the great work!
Stephan
No. There is only a 30% chance of a repeat of January 2019 and this rally continuing straight up to a new high without a test of the low.
Hi Al: To clarify what you said about trading range for a month or more.
Did you mean S&P 500 E-mini trading between 3,400 & 2,900 ?
Many Thanks,
I do not think the Emini will reach 3400 for several months at the earliest. I also think that the low will be below the current low so at least down to 2800. I also still think there is a 30% chance of a correction of 30% or more.
Al, how are you determining scalp size and stops in increased volatility? Thanks, Bruce
I just approximate and I want to keep it simple. If the bars on the 5 minute chart and on the daily chart about about 10 times normal, a scalp is 5 – 10 times normal. That is why I have been saying in the chat room that a scalp might be 20 points early in the day and then 5 – 10 points later in the day once the bars and range become smaller.
Traders need to minimize what they have to do or else they will make mistakes. It is better to make as few changes as possible and not repeatedly adjusting position sizes and scalp sizes. Just pick something much smaller that usual and stick with it until the ranges get much smaller. Take the same entries and use the same stops as always, but trade a much smaller size. When scalping, go for 5 – 20 points. A scalp is typically about 10 – 20% of the day’s range for any market.