Emini and Forex Trading Update:
Wednesday March 25, 2020
I will update again at the end of the day.
Pre-Open market analysis
Yesterday gapped up and rallied. But the bulls were unable to maintain control and the day entered a trading range. Because it closed near its high, there is an increased chance of higher prices today.
Everyone knows that the selling has been unusually extreme. There has not been a comparable initial selloff since the Great Depression. Consequently, the downside risk from here is probably not great over the next few weeks. Traders are looking for a short covering rally. It might have begun yesterday.
If the bulls can start to get bull bars on the daily chart, the bear trend will evolve into a trading range. Since the selloff was so extreme, the bears might not sell aggressively again for more than a month. The trading range could last several months. If yesterday was not the start of the trading range, it will probably begin soon.
From a fundamental perspective, the Fed basically said that they will print as much money as need to keep the economy going. Since the selloff has been huge, traders believe that the Fed will prevent much further downside near term.
Trading range likely after strong bear trend
Yesterday broke above the tight bear channel and the December 2018 low on the daily chart. Today is the follow-through day. If the bulls get another big bull bar on the daily chart, traders will conclude that the short covering rally is underway.
But since the rally will probably be minor, a trading range is likely. When the market is in a trading range, traders regularly get disappointed. Therefore today will probably not be an obviously strong bull trend day.
However, the minimum that the bulls want is a close at or above the open. That would increase the chance of higher prices over the next week.
The bears know that the daily chart is still in a Small Pullback Bear Trend. They want it to continue indefinitely. They therefore will try to make yesterday’s rally trap hopeful bulls. If today is a bear bar closing near its low, today will be a sell signal bar for a Low 1 bear flag. If tomorrow is then a big bear bar, traders will conclude that the bear trend is still intact.
Overnight Emini Globex trading
The Emini rallied overnight and then sold off. However, it has been mostly sideways. Traders want more information.
They might be waiting for tomorrow’s Jobless Claims. Everyone knows they will be horribly high. I suspect the issue is more technical. Traders are deciding if the break below the December 2018 low will succeed or fail.
With the sell climax being the most extreme since the 1929 Crash, there is probably not much left to the downside over the next few weeks. That increases the chance of higher prices and bull trend days.
But since any rally will probably end up as a leg in a 2 – 6 month trading range, traders should expect disappointing follow-through and lots of reversals. That increases the chance of more trading range trading on the 5 minute chart as well. Most days over the past 2 weeks have had at least one reversal. That is likely again today.
Yesterday’s setups

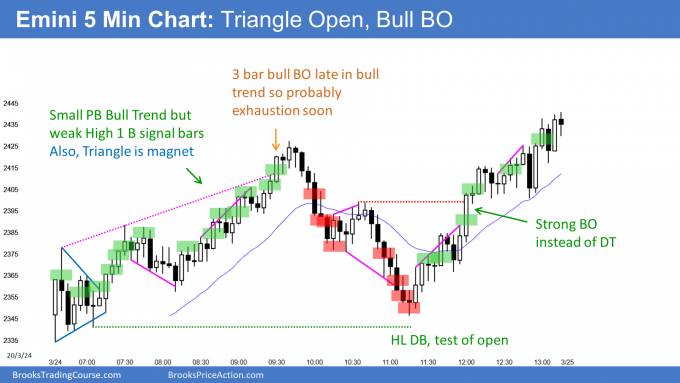
Here are several reasonable stop entry setups from yesterday. I show each buy entry with a green rectangle and each sell entry with a red rectangle. I rarely also show limit order entries and entries on the close of bars. Buyers of the Brooks Trading Course and Encyclopedia of Chart Patterns have access to a much more detailed explanation of the swing trades for each day (see Online Course/BTC Daily Setups).
My goal with these charts is to present an Always In perspective. If a trader was trying to be Always In or nearly Always In a position all day, and he was not currently in the market, these entries would be logical times for him to enter.
If the risk is too big for your account, you should wait for trades with less risk or trade an alternative market like the Micro Emini.
EURUSD Forex market trading strategies

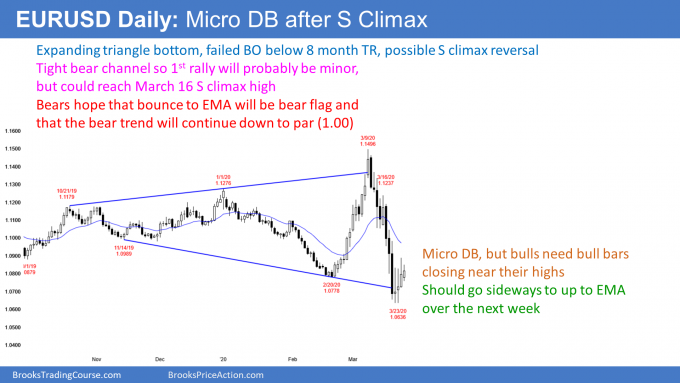
The daily chart of the EURUSD Forex market is trying to reverse up from a sell climax. There is a micro double bottom and an expanding triangle bottom.
However, the bulls need a close above the top of the 2 big doji candlesticks to make traders think that a 2 week rally might be beginning. If they get a close far above yesterday’s high, traders would expect higher prices.
But even if they get their rally, it will more likely be a leg in the 8 month trading range than the start of a bull trend. Strong bear trends typically do not reverse into bull trends without first transitioning into trading ranges. Consequently, if the bulls get a rally for a couple of weeks, most traders would like to see a test back down and then a 2nd reversal up. If they get that, the bulls would have a better chance of creating a bull trend.
Overnight EURUSD Forex trading
The 5 minute chart of the EURUSD Forex market so far has been sideways and within yesterday’s range. It is an inside day. Traders are in search of more information. If it remains that way, it will be both a buy and sell signal bar on the daily chart for tomorrow.
The past 3 days have had bull bodies. That is good for the bulls. But if there is going to be a rally, traders want to see one or more big bull trend days.
So far today, day traders have been scalping for 20 pips. The bulls will try to get today to close above the open. Today would then be the 4th consecutive bull day on the daily charts. That represents buying pressure and it increases the chance of the rally beginning soon.
Can the past 4 days be a bear flag? Of course, but after an extreme sell climax, it would probably be the Final Bear Flag. Traders expect a bounce soon.
Summary of today’s S&P Emini futures price action and what to expect tomorrow

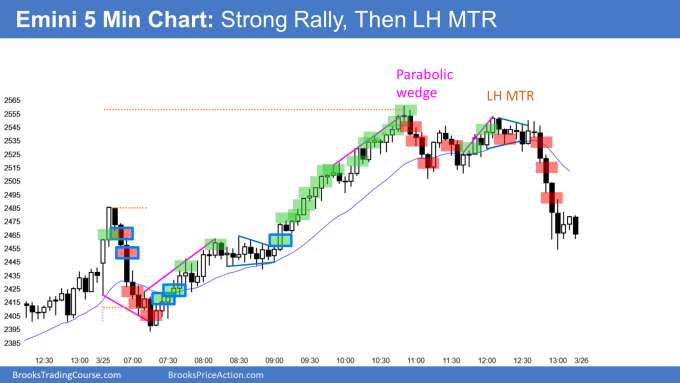
Here are several reasonable stop entry setups for today. I show each buy entry with a green rectangle and each sell entry with a red rectangle. I rarely also show limit order entries and entries on the close of bars. Buyers of the Brooks Trading Course and Encyclopedia of Chart Patterns have access to a much more detailed explanation of the swing trades for each day (see Online Course/BTC Daily Setups).
My goal with these charts is to present an Always In perspective. If a trader was trying to be Always In or nearly Always In a position all day, and he was not currently in the market, these entries would be logical times for him to enter.
If the risk is too big for your account, you should wait for trades with less risk or trade an alternative market like the Micro Emini.
End of day summary
The Emini sold off on the open but reversed up from a wedge bottom. It rallied strongly to above last week’s high after Monday fell below last week’s low. This week is now an outside up week.
However, the late selloff from a lower high major trend reversal erased much of the bullishness. There was a small bull body on the daily chart. That is enough to confirm yesterday’s rally, but is the minimum confirmation possible.
Today is a sell signal bar for tomorrow. There is still a Small Pullback Bear Trend. But after 2 closes above the month-long bear channel, there will probably be buyers below today’s low.
There are only 4 trading days left to the month. The bulls want March to close back above the 12 year bull trend line. That is just above 2600 and clearly within reach.
See the weekly update for a discussion of the price action on the weekly chart and for what to expect going into next week.
Trading Room
Traders can see the end of the day bar-by-bar price action report by signing up for free at BrooksPriceAction.com. I talk about the detailed S&P Emini futures price action real-time throughout the day in the BrooksPriceAction.com trading room. We offer a 2 day free trial.
Charts use Pacific Standard Time
When I mention time, it is USA Pacific Standard Time (the Emini day session opens at 6:30 am PST, and closes at 1:15 pm PST). You can read background information on the intraday market reports on the Market Update page.
Hi Al, for the bull breakout bar at 9 AM how would you enter after breakout? It happened so fast I hesitated to buy at market and it closed not too far from high of day resistance at open so I ended up just watching it go higher. Thanks
I think trading stupid is always a good option. By that I mean have a default approach that does not require much thought. As soon as a trader gets anxious and feels like he is missing a move, and he is hoping for a pullback, he knows everyone wants a pullback. That means everyone is eager to buy and there are far more buyers than sellers. I recommend buying 1 tick above any bull bar closing near its high, trade small, and use the appropriate stop.
Hey Al what was the reasoning for the sell below 3 today?
It was a bull trap on the open. Any strong move up or down on the open has a 50% chance of abruptly reversing. Bulls get out and bears short below that bear bar (bar 3) closing near its low.
Thanks that’s what I thought just reviewed trading the open videos
Al,
Yesterday in the overnight market we had that ledge at 2333.50. Normally the market will go both above and below a ledge. Yesterday it just went above and never below. Is that something to keep a look out for or not?
Thanks for all you do.
I pay less attention to ledges on the Globex charts and on other time frames. I therefore do not have the huge series of examples that would give me confidence about how reliable they are compared to day session ledges. However, the logic is good. If the market repeatedly hits a price, it thinks the price is important. It should want to poke through it in both directions to see what’s on the other side.
Hi Al: 30 year Treasury bond is showing strength to the up side, are you still in the opinion that it’s a trading range.
Buy reversals up from just above 160 – 165
Sell reversals down from 180 – 185
Does the above range still valid given the resent price action?
Many Thanks,
Yes!
Appreciate your responce Al !!
Will contiue to hold the short.
Thank You,