Emini and Forex Trading Update:
Tuesday May 26, 2020
I will update again at the end of the day.
Pre-Open market analysis
Last week triggered a High 1 bull flag buy signal on the monthly chart when the Emini broke above the April high. The Emini spent the entire week in a tight range oscillating around the April high.
This is the final week of the month. If this week closes above the April high, traders will expect at least slightly higher prices in May.
Friday was a pullback in a bull trend. It is therefore a High 1 bull flag buy signal bar for today. However, it had only a small bull body and it is therefore not a strong buy signal bar. Additionally, it followed a big bear bar. Also, there is a 5 day tight trading range. These factors lower the probability of a big rally today. But, the Emini should work at least a little higher.
Friday had a bull body on the daily chart and last week had a bull body on the weekly chart. The 200 day moving average and the March 3 lower high are magnets above. Traders expect the 2 month bull trend to reach at least the 200 day moving average at some point this week.
However, the entire rally is only a leg in a 2 1/2 year trading range. Traders expect a bear leg. The sell zone is around the 200 day moving average and the March 3 lower high. That means 3,000 – 3,100.
Overnight Emini Globex trading
The Emini is up 59 points in the Globex session. It will probably gap up on both the daily and weekly charts. A big gap up increases the chance of a trend day. Up is more likely than down.
However, the chart will open far above the average price. The 20 bar EMA is one measure of the average price. Many bulls will only pay far above average if the price action is far above average.
If the bulls do not get consecutive big bull bars closing near their highs within the first 5 bars, traders will expect the Emini to enter a trading range. This happens 80% of the time when there is a big gap up or down. The bulls will look to buy a double bottom or wedge bull flag near the EMA, which traders see as an average price. But the bears want the breakout to fail. They will look for a wedge top or double top and a swing down.
When there is a trading range open, there is a reduced chance of a huge trend day. That early sideways trading is a sign that traders see the price as just about right. They become less willing to buy too far above or sell too far below. Therefore, the breakout of the range usually leads to a 2 – 3 hour trend, and then either a reversal or a trading range.
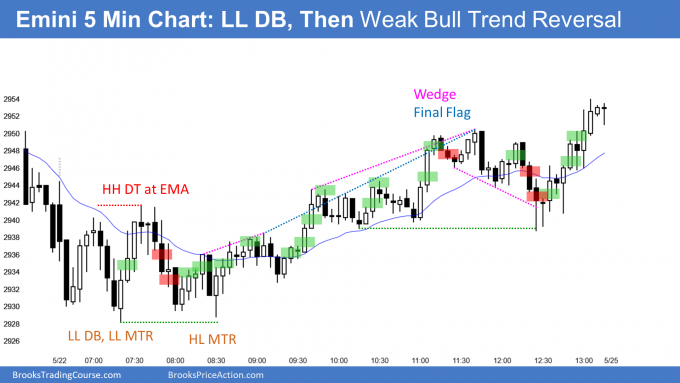
Friday’s setups

Here are several reasonable stop entry setups from Friday. I show each buy entry with a green rectangle and each sell entry with a red rectangle. I rarely also show limit order entries and entries on the close of bars. I do not want the lines to be distracting. If they are longer, I make them dotted. But, they have to be visible, so I make the shorter ones solid. Buyers of the Brooks Trading Course and Encyclopedia of Chart Patterns have access to a much more detailed explanation of the swing trades for each day (see Online Course/BTC Daily Setups).
My goal with these charts is to present an Always In perspective. If a trader was trying to be Always In or nearly Always In a position all day, and he was not currently in the market, these entries would be logical times for him to enter.
If the risk is too big for your account, you should wait for trades with less risk or trade an alternative market like the Micro Emini.
EURUSD Forex market trading strategies

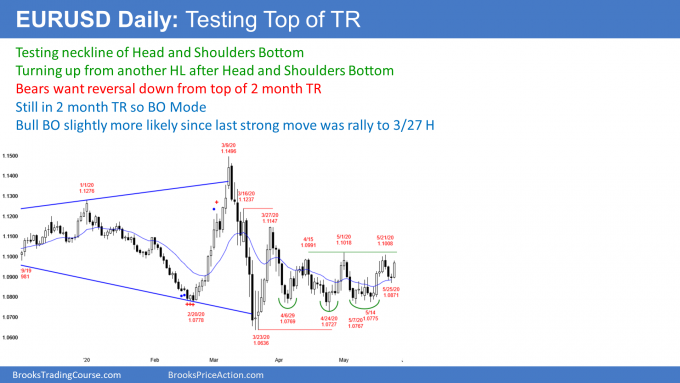
The EURUSD Forex has been in a trading range on the daily chart for 2 months. This is Breakout Mode. The last time the chart was clear was at the top of the March 27 rally. Traders assume that the trading range is slightly more likely to have a successful upside breakout.
There is a head and shoulders bottom. The EURUSD rallied from the May 7 higher low. It then pulled back and formed another higher low yesterday.
Today so far is a big bull trend bar on the daily chart. But it is important to note that the chart is still in its 2 month range. It sold off from this price level twice in the past 2 months. Traders know that trading ranges have strong legs up and down. They also know that there is no breakout until there is a clear breakout.
The bulls need consecutive bars closing above the May 1 high to conclude that the breakout will probably continue up to the next resistance. That is the March 27 high.
A more important target is the March 9 buy climax high. That is also the high of the past 19 months. If the EURUSD closes above that, traders will believe that the 2 year bear trend has ended.
Overnight EURUSD Forex trading
The EURUSD rallied overnight on the 5 minute chart overnight. Day traders were only buying.
There was a 20 pip pullback 3 hours ago and then again over the past hour. Traders are wondering if the bull trend is transitioning into a trading range. These pullbacks are big enough to make day traders begin to short for scalps. However, they will continue to buy. They know that it is easier to make money as a bull when the chart is in a bull trend.
The bulls want today to close on its high. That will increase the chance of a break above the 2 month range tomorrow. The bears always want the opposite. A bear trend today is unlikely after such a strong overnight rally.
However, the bears want the day to close well off its high. They will therefore sell rallies. If there is a 20 – 30 pip tall tail on the top of the candlestick on the daily chart, traders will see that as hesitation. It will reduce the chance of a breakout tomorrow.
Summary of today’s S&P Emini futures price action and what to expect tomorrow

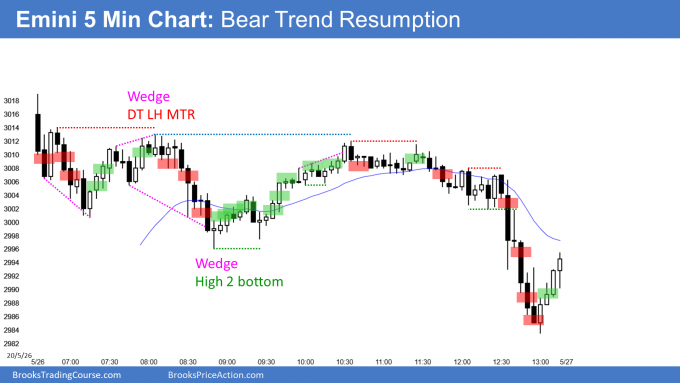
Here are several reasonable stop entry setups for today. I show each buy entry with a green rectangle and each sell entry with a red rectangle. I rarely also show limit order entries and entries on the close of bars. I do not want the lines to be distracting. If they are longer, I make them dotted. But, they have to be visible, so I make the shorter ones solid. Buyers of the Brooks Trading Course and Encyclopedia of Chart Patterns have access to a much more detailed explanation of the swing trades for each day (see Online Course/BTC Daily Setups).
My goal with these charts is to present an Always In perspective. If a trader was trying to be Always In or nearly Always In a position all day, and he was not currently in the market, these entries would be logical times for him to enter.
If the risk is too big for your account, you should wait for trades with less risk or trade an alternative market like the Micro Emini.
End of day summary
After a big gap up above the 3,000 Big Round Number and the 200 day moving average, the Emini sold off for 2 hours. It reversed up from above yesterday’s high in a big High 2 bull flag and entered a trading range. The bears got trend resumption down at the end of the day and the Emini closed back at the 200 day moving average.
Since today closed on its low, it is a sell signal bar for tomorrow. The bears see today as a failed breakout above the 200 day moving average. However, the March 3 high is still an important magnet above. Therefore, there might be more buyers than sellers below today’s low.
The Emini is now in the sell zone, which is between the 200 day moving average and the March 3 lower high. It will probably be unable to break much above that high without first retracing about half of the 2 month rally.
See the weekly update for a discussion of the price action on the weekly chart and for what to expect going into next week.
Trading Room
Traders can see the end of the day bar-by-bar price action report by signing up for free at BrooksPriceAction.com. I talk about the detailed S&P Emini futures price action real-time throughout the day in the BrooksPriceAction.com trading room. We offer a 2 day free trial.
Charts use Pacific Standard Time
When I mention time, it is USA Pacific Standard Time (the Emini day session opens at 6:30 am PST, and closes at 1:15 pm PST). You can read background information on the intraday market reports on the Market Update page.
Hello Al, I was in the traderoom today watched you type up some of your comments. I have two questions as this isn’t clear to me:
Can you please explain what do you mean by B9 and B28 reference to HS bottom pattern and also the 20 bar reference you mention using. What is that mean? Are you counting 20 bars, if so from where do you start counting?
Al’s comments typed: Bar58 – H2(Two legged pullback in a bull move) so WBLF(Wedge Bull Flag) above MA(Moving Average), COH(Close On or near High of bar), AIL(Always In Long),, HSB(Head and Shoulders Bottom, a continuation pattern in both bull and bear markets that sometimes is a reversal pattern) 9 28, holding above EMA(Exponential Moving Average, and I use a 20 bar), GXH(Globex High) MGA(Magnet Above).
Lol I had the same question a few months back. I learned pretty quick that there are no shortcuts. In order to understand the language you have to understand what is going on with the candles. That explanation takes around 3 months. Take the online trading class start to finish, and not only will you understand. You can predict what Al is saying before it unfolds
The 20 bar reference is the length of the EMA that he is using — a 20-bar EMA (versus a 50-bar or 200-bar EMA).
I understand your concern. I think of all patterns as being like molten plastic. They can be stretched and distorted, but the forces that create a pattern are the same no matter how the pattern looks.
If you imagined that bar 1 was very far up and then you saw a reversal up at 9 and a 2nd one at 28, but from a lower low, you would call this a lower low major trend reversal. Even though 1 was not very far up, it was the start of a bear trend.
If there is a reversal, I want to give it a name to help me think about all of the other times the market has made that type of reversal. I then have an idea of what to expect.
At 57 and then again at 64 and 68, the Emini tried to form a higher low after the 28 lower low. If it was successful, there would have been a higher low major trend reversal after the 28 lower low major trend reversal. With the reversal up on 9, the 3 lows would also be a head and shoulders bottom.
And yes, I use a 20 bar EMA.
Hi,
B9 refer to the bar number 9 from the open of the day .
so B20 is the bar number 20 from the open of the day .
other abbreviation MGA (magnet above) … refer to notions that al explain in his video course and books .
Another important aspect : in the traderroom Al will give more scalps setups in the brookstraingcourse the analisys is more for swing setups .
as you will discovert scalping is not for beginner , swing trading is more preferable for begginers .
Hi Al,
Why are you not considering shorting below the 9:15am bear bar? I see it as a double top at EMA. Thank you
Bar 30 was a double top with 27 and a reasonable short. I thought that 28 was a wedge selloff and a big High 2 bottom with 9 after a big gap up. That made it more likely that there would be a 2nd leg up.
However, 33 had maybe a 30% chance of leading to a bear trend. The reward was much bigger than the risk so the math is okay. Trading has to be fun. Taking a 30% trade means I lose 70% of the time. That is not fun for me, even though other traders would not be bothered.