Emini and Forex Trading Update:
Thursday June 11, 2020
I will update again at the end of the day.
Pre-Open market analysis
The Emini has been in a Small Pullback Bull Trend since the March low. Every pullback ended within 3 days. Yesterday was the 2nd day of a pullback from testing the close of 2019. It is a buy signal bar for today. But it has a bear body and it is has failed 3 times at the resistance of the 2019 close.
Traders expect that there is a lot of supply around the February high. This should lead to a 10 – 15% pullback from around that high.
Is this the start of a 10 – 15% pullback?
It is too early to say. The bears will need a couple big bear days for traders to conclude that a correction might be underway.
The rally over the past couple weeks has been exceptionally strong. If the bulls get a reversal back up within a few days, the rally will probably continue to above the February 24 high. That high is the bottom of a gap on both the daily and weekly charts.
At the moment, the Emini is more likely to pull back for several weeks before making a new high. Therefore, traders expect the upside to be limited from here this month.
Possible island top
When there was that big gap up on Friday, I said it was a possible exhaustion gap on the daily chart. I also said that there could be a gap down this week, which could create an island top.
Most island tops and bottoms are minor reversal patterns. But this rally is an extreme buy climax after a crash in March. It is now testing the old high. Many buyers from February are relieved to be able to exit with much of a loss.
That increases the chance of a swing down from here for a few weeks. Today’s big gap down could be the start of that swing down. It will be more likely if today is a big bear day on the daily chart.
Overnight Emini Globex trading
Today is rollover day in the Emini. Most day traders will still trade the June contract until tomorrow. They will then switch to September.
The Emini is down 80 points in the Globex session. There will be a big gap down on the open. That will create an island top with last week’s gap up.
When there is a big gap down, there is only a 20% chance of a strong bull or bear trend from the open. Traders expect some early trading range trading for the 1st hour or two.
The bulls will look for a double bottom or wedge bottom to buy for a swing up. However, the bears want to sell around the EMA. They will look for a wedge rally to the EMA or a double top around the EMA. They will short for a swing down.
If there is a trading range open, it would be a sign of balance. That usually reduces the chance of the day trending strongly all day. If there is a strong trend, it typically will not last until the close.
Yesterday’s setups

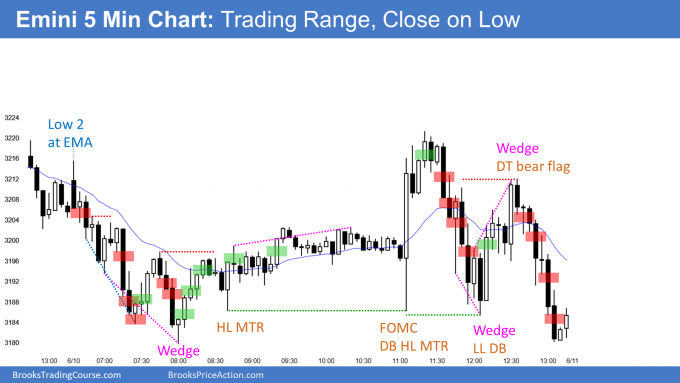
Here are several reasonable stop entry setups from yesterday. I show each buy entry with a green rectangle and each sell entry with a red rectangle. I rarely also show limit order entries and entries on the close of bars. I do not want the lines to be distracting. If they are longer, I make them dotted. But, they have to be visible, so I make the shorter ones solid. Buyers of the Brooks Trading Course and Encyclopedia of Chart Patterns have access to a much more detailed explanation of the swing trades for each day (see Online Course/BTC Daily Setups).
My goal with these charts is to present an Always In perspective. If a trader was trying to be Always In or nearly Always In a position all day, and he was not currently in the market, these entries would be logical times for him to enter.
If the risk is too big for your account, you should wait for trades with less risk or trade an alternative market like the Micro Emini.
EURUSD Forex market trading strategies

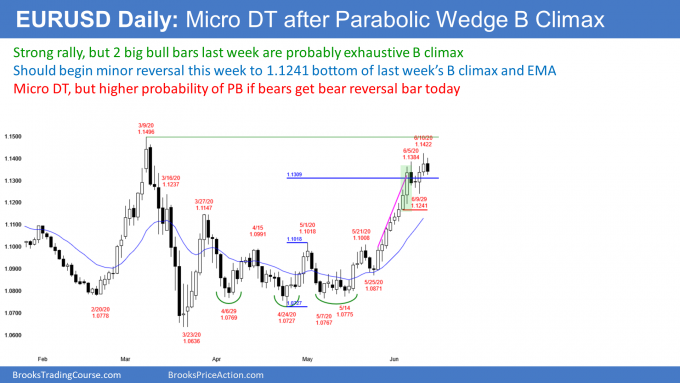
The EURUSD Forex market on the daily chart had a pair of big bull bars last week for the 3rd leg up in a parabolic wedge buy climax. There is often a brief 2nd leg up before the bulls take profits.
Yesterday is a good candidate for that 2nd leg up and the end of the rally for the next week or two. Today so far is a bear day. If it closes near its low, it would be a reasonable sell signal bar.
If this is the start of a pullback, the 1st target is the bottom of the 2 day buy climax. That is the June 3 low, which is just below 1.1200. It usually is around the EMA. If the bears break below that, the next targets are breakout points below. These are the March 27 and May 1 highs.
The bulls want any reversal down to end after a day or two. They then want the rally to quickly continue up to above the March high.
However, this particular pattern has a 70% chance of testing the June 3 buy climax low before going much higher. Even if the bull trend continued up after just a one day pullback, traders will look for a small wedge top with the June 5 and June 10 highs begin the 1st 2 legs up. Traders expect a pullback starting now or after one more brief leg up.
Overnight EURUSD Forex trading
The 5 minute chart of the EURUSD Forex market has been in a broad trading range. It is currently near the low of the day. Many bulls on the daily chart are starting to sell rallies to take profits. The bears know see that and they are selling rallies as well.
If today closes near its low, it will be a sell signal bar on the daily chart. An increasing number of bulls will begin to sell at the market and on downside breakouts instead of on rallies.
If that happens, the EURUSD will start to have bear trend days. That means there will be several bear trends on the 5 minute chart.
So far, the bulls are buying selloffs and the bears are buying back their shorts around the prior low. That is creating the overnight trading range. But there is an increased chance of swings down on the 5 minute chart over the next few days.
Remember, there is a 30% chance that the 3 week rally continues up to above the March high without a pullback to the June 3 low. Consequently, traders will swing trade longs if there is a strong rally today or tomorrow.
Summary of today’s S&P Emini futures price action and what to expect tomorrow

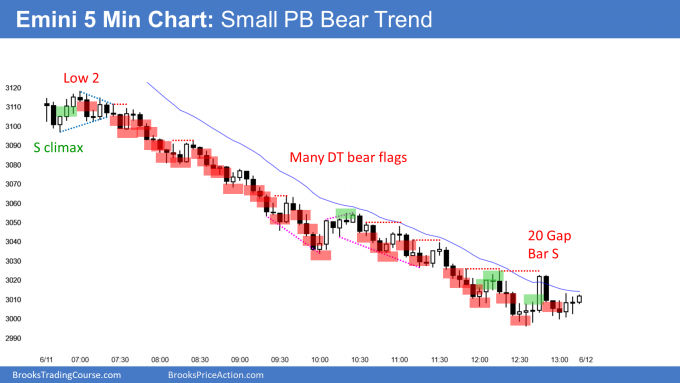
Here are several reasonable stop entry setups for today. I show each buy entry with a green rectangle and each sell entry with a red rectangle. I rarely also show limit order entries and entries on the close of bars. I do not want the lines to be distracting. If they are longer, I make them dotted. But, they have to be visible, so I make the shorter ones solid. Buyers of the Brooks Trading Course and Encyclopedia of Chart Patterns have access to a much more detailed explanation of the swing trades for each day (see Online Course/BTC Daily Setups).
My goal with these charts is to present an Always In perspective. If a trader was trying to be Always In or nearly Always In a position all day, and he was not currently in the market, these entries would be logical times for him to enter.
If the risk is too big for your account, you should wait for trades with less risk or trade an alternative market like the Micro Emini.
End of day summary
The Emini gapped down and formed a 4 day island top. This was a crash day. There were waves of relentless selling.
On the daily chart, today was a huge bear candlestick. This is a Bear Major Surprise Bar on the daily chart. Traders should expect lower prices. I have been saying that the correction would be about 15%. That is still likely. With today’s selloff, the Emini is almost halfway there.
On the weekly chart, this week is now an outside down candlestick. Tomorrow is Friday so weekly support and resistance will be important. This is especially true in the final hour. The bulls want the week to close above the 3000 Big Round Number and last week’s low. They hope that today is just a bear trap and that the Emini will still make a new high this month.
The bears want this to be the start of a 15% selloff. It is a good candidate. They want tomorrow to be a bear day. Also, they want the week to close on the low. That would increase the chance of lower prices next week.
Since today was a sell climax, there will probably be at least a couple hours of sideways to up trading tomorrow.
See the weekly update for a discussion of the price action on the weekly chart and for what to expect going into next week.
Trading Room
Traders can see the end of the day bar-by-bar price action report by signing up for free at BrooksPriceAction.com. I talk about the detailed S&P Emini futures price action real-time throughout the day in the BrooksPriceAction.com trading room. We offer a 2 day free trial.
Charts use Pacific Standard Time
When I mention time, it is USA Pacific Standard Time (the Emini day session opens at 6:30 am PST, and closes at 1:15 pm PST). You can read background information on the intraday market reports on the Market Update page.
Hi Al,
This is regarding the FOMC day chart, In Daily Set-ups, you have marked ‘Huge Bull bar, after 2 big bear bars is bad B signal bar’
Is it because of the FOMC report or generally also it would be a bad B signal bar. Why I am asking is because I would have considered it a Good B signal bar, and would have considered it a F BO buy below the TR that developed above the big FOMC Bull bar. Also, since the bull bar was pretty big I am sure I would have bought above that bar (I did not because I had stopped trading for the day).
So had it not been FOMC time of the day, and such volatile market, should we still not consider such a bar a good B signal bar?
P.S. I would have also considered it DB with the big FOMC bull bar..
I am always suspicious of huge signal bars in the middle of a trading range. The risk is big and the probability is low buying in the middle of the range. That is especially true after 2 big bear bars and when the bull bar has a big tail compared to its body. I want to see strong follow-through before buying, like 2 or 3 bull bars.
Hello Al, it seems like you did not want to trade the short side today as a daytrader although you were short with options from yesterday. You have written in your books how emotionally difficult it can be to sell low in a strong bear trend. Today fits that day type perfectly with all of the gaps and body gaps. The book version of Al Brooks says wait for a reversal setup to form, and trade the failure. Your chatroom discussion was mostly about finding longs today. (Final Flag Hope around 19+21 but were bear bars) At what point does a trader just give up on the longs and go short despite the “selling too low” fear. Daily/Weekly charts had good context for the big sell off since you had put on the short with options. Were you afraid of letting your short bias carry over into your day trading and spoil your objectivity?
I totally agree with your comments. Most traders on a day like this should focus on selling either Low 1 and Low 2 sell signals or selling the close at the bottom of the move. Since the stop was far above for each short, traders would have to trade small. I mentioned using micro Eminis several times.
Trading has to be both fun and profitable. For me, when the bars are big and the stop for the shorts is far above, I often do not enjoy selling the close at the low of the move. This is because there is usually only a bar or two left before there is another reversal up. But I said throughout the day that there were several reasonable Sell The Close trades at the low of the move.
In Small Pullback Bear Trends, I like to sell Low 1 and Low 2 pullbacks, but I prefer bear sell signal bars. Most of the sell signal bars were not bear bars closing on their lows, at least not on the 5 minute chart.
I usually approach every day looking for both buy and sell setups. Often, the least stressful trade is betting on a pullback. I therefore often look to buy reversals up in bear trends for scalps while hoping for a Low 1 or Low 2 with a good sell signal bar.
My biggest long scalp today was 11 points. While that is good for most days, it is nothing special on a day where the range was 120 points.
Also, as you know, I came into the day short. I was short by being long an inverse ETF and not by holding puts.
Coming in short makes me worry less about selling at the low or selling at all because I am already short. I tend to view every buy scalp as a form of temporary profit taking on my short or as a hedge.
Had I not been short coming into the day, I would have been more willing to take the Low 1 and Low 2 sell signals and use a wide stop.
I like your instinct because you are right that being short in some manner was the best choice.
Hi Al, I noticed on yesterday’s chart that you ignored the overnight price action for the first Low 2 at EMA short. Is this something we would usually do to determine price action?
I forgot on this version, but I did put it on the Daily Setup and the Encyclopedia slides.
It looks like the price will go down below last week’s low. If that’s the case, it will be an outside bar in weekly chart. Will it be a very bearish signal for investors? And will we able to see price going back up to form some kind of double top or the price will simply go down?
I will write about this in the weekend update. Looks good for the bears for the next couple weeks.
That will be great! It’s sad that I sold out half of my short at around 3200 with a loss on Monday…Hoping for entering the position with a higher price
Hi Al, if I am trading an individual stock on 5 mins chart, and am also already looking at 15 mins, hourly, daily, weekly, monthly chart of this stock, do I need/is it necessary to also consider how the overall market (nasdaq, s&p, etc) goes? I find it is a bit distracting sometime.
When trading, all a trader needs is the chart in front of him to make money. If he is able to incorporate more information and it makes him more profitable and not more stressed, then that’s fine. Whatever works is good. The goal is both fun and profit. Traders need both to do this for a career.
Morning Al,
Question about the chart from yesterday, Bar 6 failed reversal. You’ve said that tests of support/resistance don’t need to be exact. However in this case you state that B6 was a poor entry because it came within 1 tick of the Globex low.
In general do you recommend waiting for a 2eb/2es if important support/resistance hasn’t been fully tested? Hope this makes sense… Thanks.
Dave
When in doubt, stay out. 2nd signals are higher probability, but we often do not get them. 6 was the 6th bar in a micro channel. While a PW with 1 and 3, it was better to wait.