Emini and Forex Trading Update:
Monday March 23, 2020
I will update again at the end of the day.
Pre-Open market analysis
The Emini sold off further last week. It closed just above the January 20, 2017 open. That is the day President Trump assumed office. The market is clearly paying attention to that price. It reversed up overnight from below that price.
Traders expect a strong short covering rally to begin soon. This selloff might fall to the next support at 2000 before the bears take some profits and the bulls stop dumping their stock.
There will probably be a strong short covering rally beginning within a couple weeks. It might begin today. The bear trend, however will last all year at a minimum.
Is the end of the 1st leg down on the daily chart?
If the bulls get 2 or 3 big bull trend days this week, then yes. However, the daily chart is in a Small Pullback Bear Trend. There have been several big bull days over the past few weeks. The bulls have not been able to create more than a 2 day pullback since the bear trend began.
Traders will only see this as a short-term low if the bounce grows to at least 3 or 4 days this week. Otherwise, they will look for another leg down.
Infection rate should slow by end of April
At some point, enough people will have changed their behavior so that the number of new cases will be less than the number of people getting better. That means that there will be a peak in the number of active infections. Patients newly diagnosed have infected people for two weeks before their diagnosis. Clearly, lots of people are changing their behavior right now. Therefore, the peak will probably come in late April.
It is important to note that stock prices are based anticipated future earnings. Therefore, the short term bottom will come before the peak in active infections is reached. If the infection rate falls by the end of April, the short covering will probably begin within the next couple weeks. If the bear rally does not begin soon, it will likely mean that the peak of infections will come after April.
The Spanish Flu in 1918 had a peak in the spring. However, there was a resurgence in the fall. A second or third surge often happens with pandemics. Consequently, there probably will be another surge in the fall. There might even be a 3rd one before there is a vaccine next year.
Overnight Emini Globex trading
The Emini repeatedly bounced up from -5% limit down overnight. It has rallied strongly over the past 30 minutes. The Fed’s promise to print as much money as needed and Congress’s action on a rescue plan are increasing the confidence of the bulls and making bears begin to take windfall profits.
Today could be a short-term bottom. Because the daily chart is in a parabolic wedge sell climax, a rally could easily last a couple weeks. It could even last a couple months.
Day traders today will be looking for swing trades up if the rally continues. The bulls will buy pullbacks and strong breakouts. The bears will wait to sell until after the chart enters a trading range.
A ledge is a magnet
It is important to note that the limit down trading overnight created a ledge bottom in the Globex market. A ledge bottom is a tight trading range with at least 4 bars having exactly the same low. This ledge is also present on the 60 minute chart.
Markets usually test below ledges before there is a bull trend. The test usually comes within 100 – 150 bars. On the 60 minute chart, that would be a few weeks.
Consequently, traders should assume that any rally from here will probably dip below the overnight low within a few weeks. But even if it did not, the odds are that there would be at least one more new low within a year. The final low in a bear trend typically comes about a year after it begins.
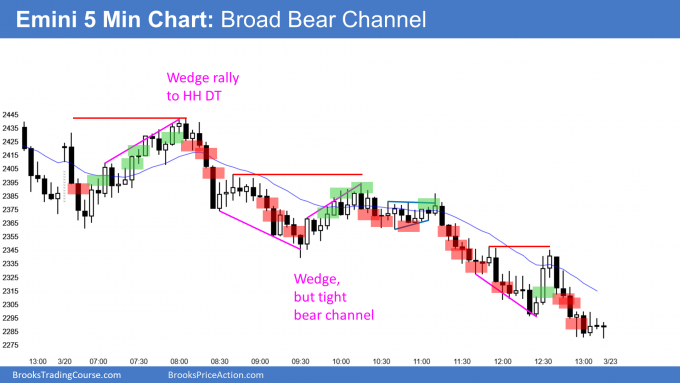
Friday’s setups

Here are several reasonable stop entry setups from Friday. I show each buy entry with a green rectangle and each sell entry with a red rectangle. I rarely also show limit order entries and entries on the close of bars. Buyers of the Brooks Trading Course and Encyclopedia of Chart Patterns have access to a much more detailed explanation of the swing trades for each day.
My goal with these charts is to present an Always In perspective. If a trader was trying to be Always In or nearly Always In a position all day, and he was not currently in the market, these entries would be logical times for him to enter.
If the risk is too big for your account, you should wait for trades with less risk or trade an alternative market like the Micro Emini.
EURUSD Forex market trading strategies

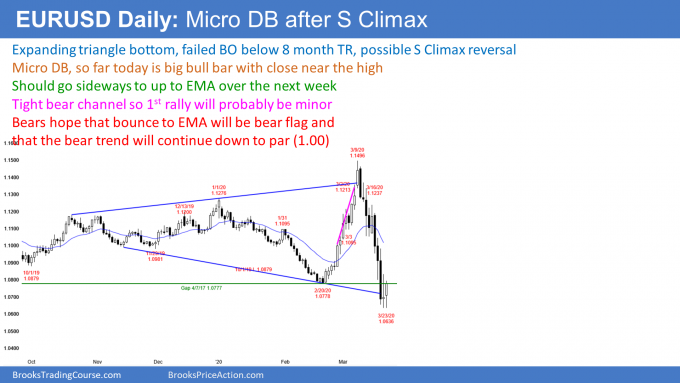
The daily chart of the EURUSD Forex market so far has a big bull bar today. It is the 2nd consecutive bull bar with a prominent tail below. Traders see it as a micro double bottom with Friday’s low.
If today closes near its high, it will be a buy signal bar for tomorrow. There is an expanding triangle bottom. The bulls hope that the 2 week collapse was just a sell climax test of the bottom of the 8 week trading range and of the April 2017 gap.
There was a 3 day spike down from the March 9 high. Then, there was a 3 day collapse to a new low. That is a type of parabolic wedge sell climax, which usually attracts profit takers.
There will be a short covering rally soon. It might begin today. Once it begins, the 1st target is the EMA.
Traders will expect it to last a week or two. They then expect a test down. If there is a 2nd reversal up, there would be a double bottom. That would have a better chance of halting the bear trend and maintaining the 8 month trading range.
Overnight EURUSD Forex trading
The 5 minute chart of the EURUSD Forex market reversed up over the past hour after falling 2 pips below Friday’s low overnight. So far, today is a bull trend reversal day.
Because of the location and the sell climax on the daily chart, there is an increased chance of a rally lasting a week or more. That increases the chance of several bull trend days this week. If so, traders will find it easier to make money buying breakouts and pullbacks than selling rallies.
If today enters a trading range, the bears will be more willing to sell. Also, the bulls will switch to scalping from swing trading.
Can the rally over the past hour be a bull trap. Not likely. Traders would need to see a break below the overnight low before concluding that the bears had retaken control of the day.
Summary of today’s S&P Emini futures price action and what to expect tomorrow

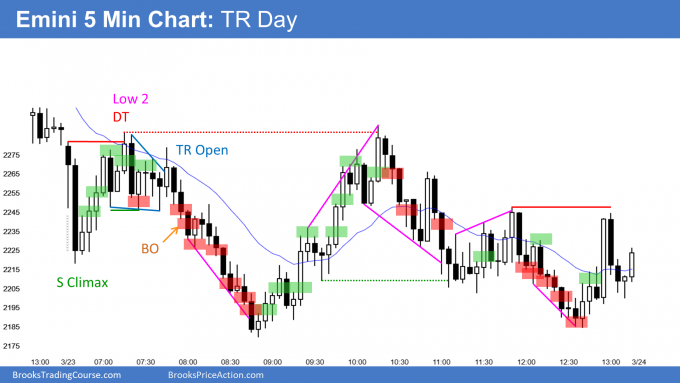
Here are several reasonable stop entry setups for today. I show each buy entry with a green rectangle and each sell entry with a red rectangle. I rarely also show limit order entries and entries on the close of bars. Buyers of the Brooks Trading Course and Encyclopedia of Chart Patterns have access to a much more detailed explanation of the swing trades for each day.
My goal with these charts is to present an Always In perspective. If a trader was trying to be Always In or nearly Always In a position all day, and he was not currently in the market, these entries would be logical times for him to enter.
If the risk is too big for your account, you should wait for trades with less risk or trade an alternative market like the Micro Emini.
End of day summary
The Emini formed a trading range day today. It did not fall below the Globex low. Traders see that the Emini formed a ledge bottom in the Globex session. A ledge is a magnet. The Emini might have to dip below that low tomorrow before many bulls will consider buying.
Everybody knows that there will be a strong short covering rally soon. But no one knows if it begins this week or in a few weeks. Until there is a strong reversal up, traders continue to expect at least slightly lower prices.
See the weekly update for a discussion of the price action on the weekly chart and for what to expect going into next week.
Trading Room
Traders can see the end of the day bar-by-bar price action report by signing up for free at BrooksPriceAction.com. I talk about the detailed S&P Emini futures price action real-time throughout the day in the BrooksPriceAction.com trading room. We offer a 2 day free trial.
Charts use Pacific Standard Time
When I mention time, it is USA Pacific Standard Time (the Emini day session opens at 6:30 am PST, and closes at 1:15 pm PST). You can read background information on the intraday market reports on the Market Update page.
Hi Al,
New here, and have been actively trading for the past 3 years before I was recommended to your content by a mentor of mine. I am not trading the emini, but us30 futures. I might be playing a dangerous game but it seems most things you say are largely valid for us30 as well.
Question: when you say a bounce in emini, you imply the area around 2700-3000, which has been kind of the TR for the past couple years, before another leg down for the final bottom? Or that would be too big of a pullback? How should we go about figuring out the height of the bounce?
Thank you so much for sharing your insights, it makes a huge difference for a lot of folks! To me, for sure!
The market is repricing itself after a change in profit expectations. At some point, traders will conclude that the market might have gone too low. Since this sell climax is extreme, the bounce might be very big, like up to that 3000 top of the 2 year range. In addition, it could last many months. However, the final low in a bear market typically comes about a year after it began.