Trading Update: Wednesday February 16, 2022
Emini pre-open market analysis
Emini daily chart
- Yesterday was a bull bar closing near its high, which is an Emini strong entry bar for the February higher low major trend reversal.
- Even though the 5-minute chart closed in the middle of its range, the daily chart closed at the high of the day. The CME uses an algorithm to calculate the theoretical close, which is used on the daily chart, and it is often very different from the close on the intraday chart.
- The Emini is in the middle of a 7-month trading range. A trading range is neutral. There is about a 50% chance of a successful bull breakout and a 50% chance of a successful bear breakout.
- There have been many strong moves up and down, and each has led to a reversal.
- Every trading range always has both a reasonable buy setup and a reasonable sell setup.
- The bears have a head and shoulders top and a lower high major trend reversal.
- The bulls have a double bottom with the October and January lows.
- Because of the back-to-back OO patterns (consecutive outside bars) on the monthly chart, the odds are slightly more likely that the Emini will break below the January low before it breaks above the January high.
- However, I have been saying that February might remain an inside bar, which means the breakout might wait until March or April. I also said that it could be a bull bar with March then being a 2nd leg down.
- The Fed knows it messed up. I have been saying for over a year that they were lying about not raising rates until 2023. The monthly chart of the bond market has a clear top that should last for the remainder of your trading career. Rates can only go sideways to up, with occasional minor dips.
- I think the Fed’s 1st rate hike will be 0.5% and not 0.25%. It should be 1%, but I believe Powell is in denial. They know that they will raise rates at least 4 times over the next year. I think they will increase the rate by at least 1.5% over the next year.
- They are afraid that short term rates will go above long term rates. And they might.
- That is an inverted yield curve and it usually leads to a recession.
- No Fed member wants a recession on his or her watch.
- But the Fed made the mistake of mismanaging the economy. It should now fix it, even if the fix leads to a recession next year.
- It probably will not. But if it does, it will be a great buying opportunity for the cash in your retirement account.
Emini 5-minute chart and what to expect today
- Emini is down 15 points in the overnight Globex session.
- It has been reversing every few days for several weeks and therefore day traders expect reversals. Most recent days have had at least one swing up and one swing down, and most have begun with trading range opens.
- If there is a series of strong trend bars in either direction early in the day, the odds of a trend day will go up.
Yesterday’s Emini setups

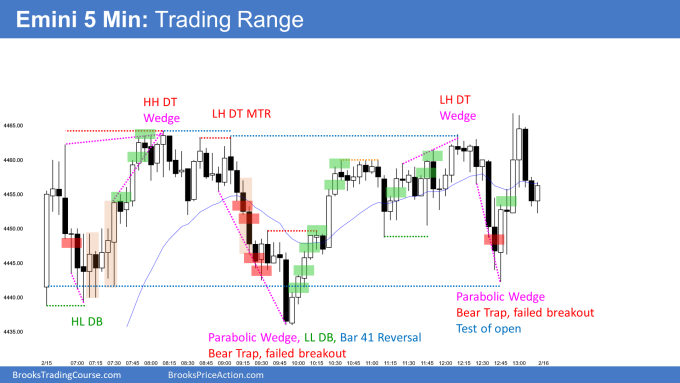
Here are several reasonable stop entry setups from yesterday. I show each buy entry with a green rectangle and each sell entry with a red rectangle. Buyers of both the Brooks Trading Course and Encyclopedia of Chart Patterns have access to a much more detailed explanation of the swing trades for each day (see Online Course/BTC Daily Setups).
My goal with these charts is to present an Always In perspective. If a trader was trying to be Always In or nearly Always In a position all day, and he was not currently in the market, these entries would be logical times for him to enter. These therefore are swing entries.
It is important to understand that most swing setups do not lead to swing trades. As soon as traders are disappointed, many exit. Those who exit prefer to get out with a small profit (scalp), but often have to exit with a small loss.
If the risk is too big for your account, you should wait for trades with less risk or trade an alternative market like the Micro Emini.
EURUSD Forex market trading strategies
EURUSD Forex daily chart

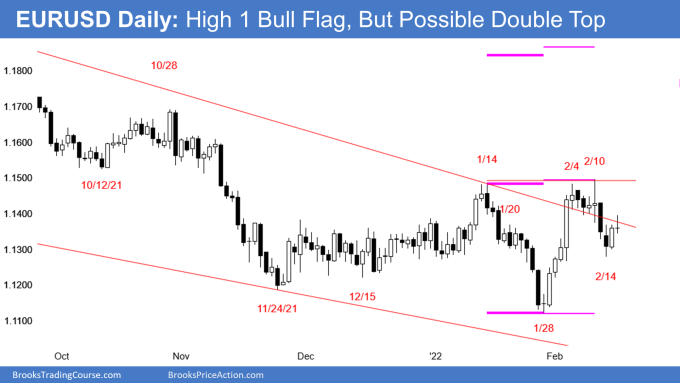
- Yesterday was a bull bar closing near its high and a High 1 buy signal bar. Today so far is doji day and another trading range day.
- The bulls correctly believe that the 3-day selloff is more likely a pullback from breakout above January 14 high than a reversal down from a double top (January 14 and February 10).
- However, the past 8 days are creating trading range price action. The pullback might have to go more sideways to down before the bulls will buy.
- Traders want to seek a series of strong trend bars in either direction before looking for a trend. In the meantime, they are betting on reversals and taking quick profits.
- I believe Putin will not invade because he will conclude that the price is too high.
- He still wants the Ukraine (he calls it “my Ukraine”), but he will probably use every non-military tool at his disposal. For example, he will try to manipulate Ukrainian politics to make it more friendly to Russia. That takes pressure off of the EURUSD.
- This is consistent with the daily, weekly, and monthly EURUSD charts. There should be a rally lasting at least a couple months and reaching the October high.
- Buyers are waiting until they are certain that Putin will not invade and that the problem will not spread further west in Europe.
Summary of today’s S&P Emini futures price action and what to expect tomorrow

End of day summary
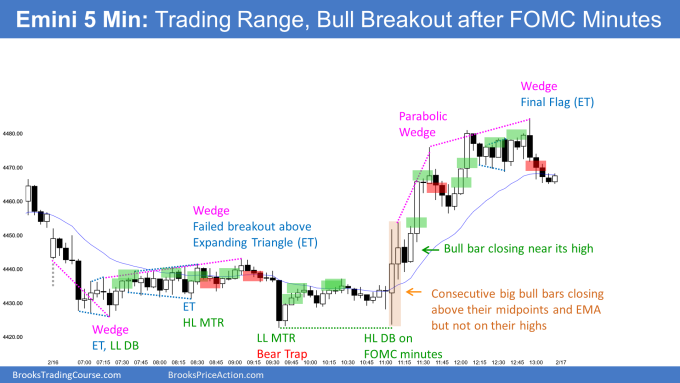
- The Emini had a small double bottom and expanding triangle on the open.
- There was a weak rally and a bear trap in a trading range for the 1st half of the day.
- The FOMC minutes led to a strong rally into the close.
- Today was an outside up day and it closed one tick above yesterday’s high, but there was a big tail on top.
- Traders are still deciding if the reversal up from the January low will continue or if the Emini will break below the January low.
- Even if there is a break above the double top (February 2 and 9), the odds still favor a break below the January low before a break above the January high. This is because of the back-to-back OO patterns on the monthly chart,
See the weekly update for a discussion of the price action on the weekly chart and for what to expect going into next week.
Trading Room
Traders can see the end of the day bar-by-bar price action report by signing up for free at BrooksPriceAction.com. I talk about the detailed S&P Emini futures price action real-time throughout the day in the BrooksPriceAction.com on trading room days. We offer a 2 day free trial.
Charts use Pacific Time
When I mention time, it is USA Pacific Time. The Emini day session charts begin at 6:30 am PT and end at 1:15 pm PT which is 15 minutes after the NYSE closes. You can read background information on the market reports on the Market Update page.
My reading is we could see bar 32 as a lower high double top with the first bar’s opening. Which is an L2, therefore sell signal. That makes bar 37 the third push of the wedge of bars 5 and 10, i.e. H2, buy signal
Usually I don’t trade on news. I am also aware to get out when they release the FOMC report. BUT, do we need to be extra careful when they release the minutes to the FOMC a month later?
I wasn’t in the market, but bar 55 – 60 (5 min chart) was not expected today.
The Fed publishes the dates of the meetings a year in advance, but not the dates of the minutes. When a day begins very quietly like today, I check to see if it is a minutes day.
Thank you, Dr. Brooks. Good to know! I marked all the FOMC meetings on my calendar in advance. I did find a place where they document the minutes release too. Unlike their other calendar you have to go deeper to find it month by month.
https://www.federalreserve.gov/newsevents/calendar.htm
Also, thank you for calling out, “The CME uses an algorithm to calculate the theoretical close, which is used on the daily chart, and it is often very different from the close on the intraday chart.” This had me spinning for a couple hours one weekend.
Economic calendars like Econoday will show events like today’s FOMC Minutes.
Thanks Andrew.