Emini strong rally stalling at 2018 triple top
I will update again at the end of the day.
Pre-Open market analysis
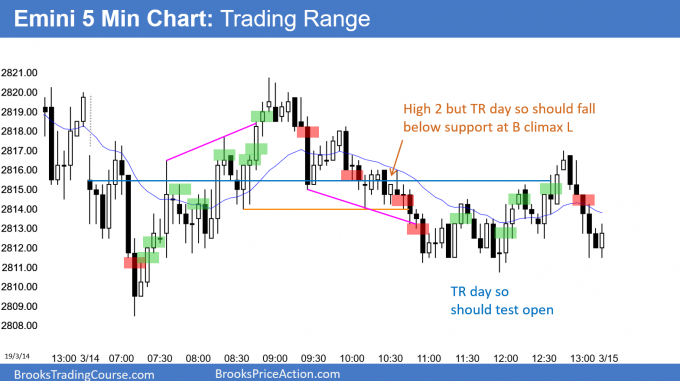
After Wednesday broke above last week’s high, yesterday was an inside day and a trading range day. It is a High 1 bull flag, but just below the resistance of the 2018 triple top and it had a bear body. There might be more sellers than buyers above the bear buy signal bar at resistance.
But, the odds favor another trading range day today. Today is Friday so the weekly chart is important. The bulls want this week to close above last week’s high. However, the bears want a big tail on this week’s candlestick to make traders wonder if the 2 month rally will fail.
Most likely, the week will close near its high and today will not do anything to change that. There is not much incentive for either the bulls or bears to be aggressive today. They would each need a huge trend day to alter what the week has already done. Since that is unlikely, today will probably be another trading range day. It might get drawn to last week’s high in the final hour.
Overnight Emini Globex trading
The Emini is up 13 points in the Globex session. There might be a small gap up on the open. A small gap typically closes in the 1st hour. It might open within a few points of the October high, which is the highest of the 3 tops in last year’s triple top. It may even gap above that important resistance.
However, the daily chart has been in a trading range for 16 months. Consequently, most breakouts fail. Therefore, a break above the triple top is likely to fail. But, the breakout could continue to go up for a couple weeks before there is a reversal down.
Therefore, day traders should be ready for a surprise up or down today. There is an increased chance of a big trend up above resistance. In addition, there is also an increased chance of a big reversal down, especially since yesterday is a bad buy signal bar for today.
What is most likely? Today will be another trading range day, even if it goes above the October high. This is because the bulls have already accomplished enough for the week. There is no incentive to do a lot more. They probably cannot reach the all-time high today, which is the next target, and they therefore will likely just be happy to close the week near its high.
Yesterday’s setups

Here are several reasonable stop entry setups from yesterday. I show each buy entry with a green rectangle and each sell entry with a red rectangle. I rarely also show limit order entries and entries on the close of bars. My goal with these charts is to present an Always In perspective. If a trader was trying to be Always In or nearly Always In a position all day, and he was not currently in the market, these entries would be logical times for him to enter.
EURUSD Forex market trading strategies

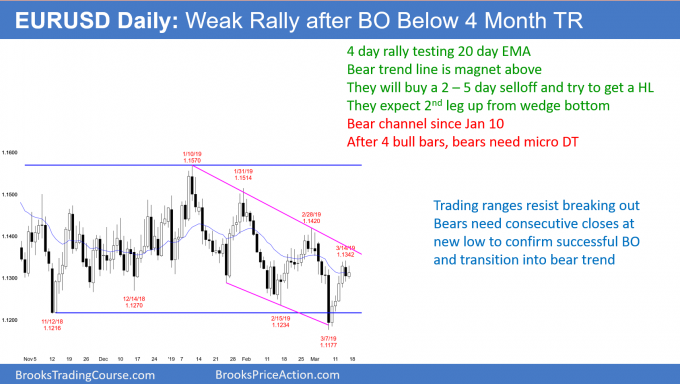
The EURUSD daily Forex chart yesterday formed a bear reversal bar. But, it had a big tail below. In addition, the 4 day rally has been strong and the bear trend line at the top of the 3 month bear channel is nearby. It is a magnet and the chart might not be able to escape its pull. Consequently, the chart might go sideways to up for at least a few more days to get there. Alternatively, there will be a test down and then a rally to the bear trend line.
The bulls hope that the wedge bottom and failed break below the 4 month range is the start of a bull trend. Wedge bottoms typically have a 2nd led sideways to up. Therefore, the bulls will buy a 2 – 5 day selloff.
They hope that they can create a higher low. It would be a higher low major trend reversal buy setup. That would increase the chance of a test of the February high above 1.14 and possibly the top of the 4 month range.
If today remains a bull inside bar, it would be a buy signal bar for Monday. That would increase the chance of a test of the bear trend line next week.
The 4 month trading range is continuing
For 4 months, the legs up and down have reversed every 2 – 3 weeks. Traders will expect a reversal down from the bear trend line. If next week goes above today’s high and reverses, the bears would have a micro double top. That would likely lead to a 2 – 5 day test back down. The bears want a break to a new low, but a higher low is more likely after a wedge bottom.
There is no sign that the trading range is about to convert into a trend up or down. Traders are waiting for news from Brexit before they will bet on a new trend.
Overnight EURUSD Forex trading
The EURUSD 5 minute Forex chart has been in a 20 pip range overnight. Therefore, today will probably be another trading range day. The bulls want today to close near its high so that it will be a good buy signal bar for Monday.
However, the bears see the 6 day bull micro channel as extreme. They expect a pullback Monday or Tuesday. They would like today to close near its low. If it does, it would be a stronger sell signal bar. That would increase the chance of several days down instead of just 1 – 2 days down and then a rally to the bear trend line on the daily chart.
Because of the significance of a bear or bull body today, day traders will fight over the close of the day. Since having a big bull or bear day adds little predictive value to what will happen next week, today will probably not be a strong trend day up or down.
More likely, it will continue yesterday’s trading range price action. Traders will then wait for next week to decide whether to test down to a higher low or up to the bear trend line.
Summary of today’s S&P Emini futures price action and what to expect tomorrow

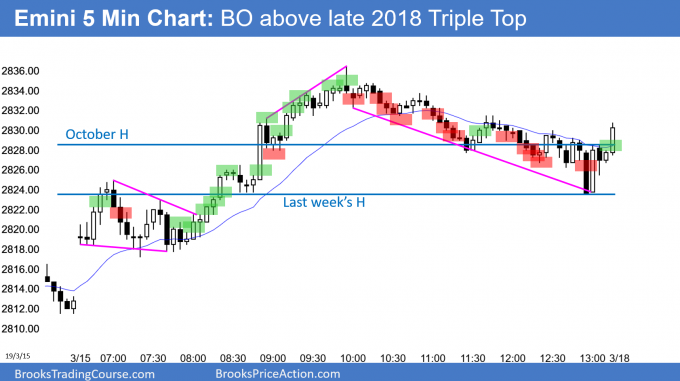
Here are several reasonable stop entry setups for today. I show each buy entry with a green rectangle and each sell entry with a red rectangle. I rarely also show limit order entries and entries on the close of bars. My goal with these charts is to present an Always In perspective. If a trader was trying to be Always In or nearly Always In a position all day, and he was not currently in the market, these entries would be logical times for him to enter.
End of day summary
The Emini broke strongly above the October-November-December triple top today to a new 6 month high. It reversed back down after a Spike and Wedge Bull Channel at the measured move target but rallied into the close.
By closing above its midpoint, today is a weak sell signal bar for Monday on the daily chart. However, it had a bull body and the momentum up has been strong over the past week.
At the moment, the odds are that there will be at least a small 2nd leg up after such an important breakout. But, the Emini should reverse down for at least several weeks beginning within a couple weeks.
The daily chart has been in a trading range for 16 months. Most breakouts fail. Consequently, this breakout will probably reverse down within a couple of weeks rather than continuing straight up to the all-time high.
Monday is the follow-through day. If it is a bear day closing on its low, the bears might take control next week. If it is a bull day, there will probably be at least another small leg up. But if it goes up, the rally will probably just last 1 – 2 weeks. The odds favor at least a few weeks down beginning soon.
See the weekly update for a discussion of the price action on the weekly chart and for what to expect going into next week.
Trading Room
Traders can see the end of the day bar-by-bar price action report by signing up for free at BrooksPriceAction.com. I talk about the detailed S&P Emini futures price action real-time throughout the day in the BrooksPriceAction.com trading room. We offer a 2 day free trial.
Charts use Pacific Standard Time
When I mention time, it is USA Pacific Standard Time (the Emini day session opens at 6:30 am PST, and closes at 1:15 pm PST). You can read background information on the intraday market reports on the Intraday Market Update page.
When you take ½ of your position off at 2 points, what do you do with the stop on the remaining ½? If you keep it below the prior low you could still end up with a loss on the entire trade, but if you move it to your entry point, there’s a good chance you will be stopped out for only 1 point per ½.