Emini and Forex Trading Update:
Monday April 19, 2021
Pre-Open market analysis of daily chart
- Friday was a 2nd bear bar in 3 days after the streak of 13 consecutive bull bars ended on Wednesday. Emini now at start of 5th week of strongest rally in a year.
- This is a sign that bulls are starting to take profits.
- The streak was the longest streak in 10 years, and the Emini is therefore extremely overbought. This therefore increases the chance of a 5 to 10% profit taking selloff starting at any time.
- Until there is a reversal down, traders will bet that the market will continue to do what it has been doing, and that means buying.
- The Emini will probably have to transition into a trading range, for at least a few days before the bears can get more than a 3-day pullback.
Overnight Emini Globex trading on 5-minute chart
- The Emini is down 8 points in the Globex session.
- On the daily chart, it is extremely overbought. That increases the chance of a big bear day at any time.
- The 2 bear days last week in a buy climax reduce the chance of a big bull trend day.
- Most recent days have had at least one leg up and one leg down.
- Most recent days have had a lot of trading range trading.
- Day traders will expect that again today.
- If there is a series of consecutive trend bars up or down in the 1st hour, there would be an increased chance of a strong trend day.
Friday’s Emini setups

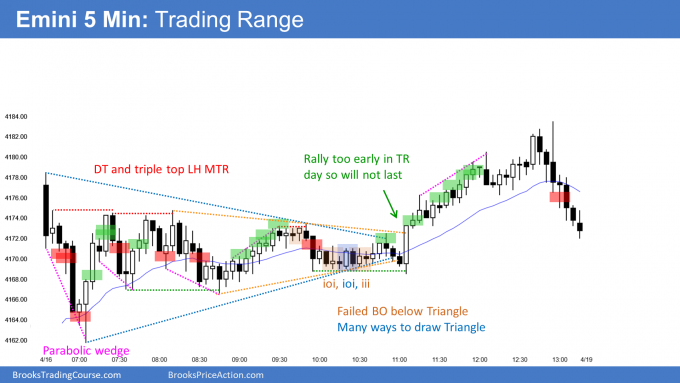
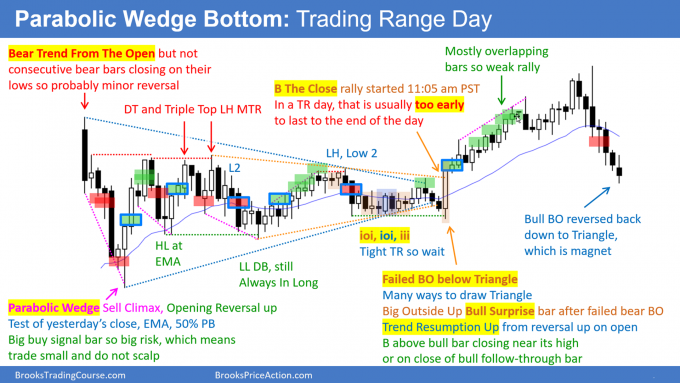
Here are several reasonable stop entry setups from Friday. I show each buy entry with a green rectangle and each sell entry with a red rectangle. Buyers of both the Brooks Trading Course and Encyclopedia of Chart Patterns have access to a much more detailed explanation of the swing trades for each day (see Online Course/BTC Daily Setups).
My goal with these charts is to present an Always In perspective. If a trader was trying to be Always In or nearly Always In a position all day, and he was not currently in the market, these entries would be logical times for him to enter.
If the risk is too big for your account, you should wait for trades with less risk or trade an alternative market like the Micro Emini.

EURUSD Forex market trading strategies
EURUSD Forex daily chart

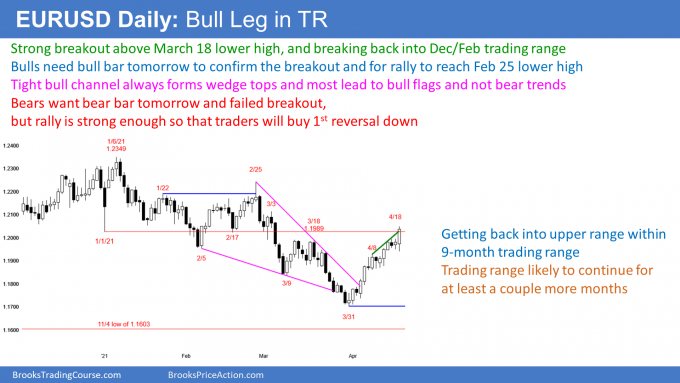
- Strong 4-week rally breaking above March 18 lower high. Bulls need bull bar today to confirm the breakout.
- If today is a bear bar, might get a pullback over the next week.
- Rally is within 9-month trading range. Bulls trying to get back up into upper Dec/Feb trading range within 9-month range.
- 9-month trading range likely to continue for at least a couple months.
- Rally is strong enough so that bulls will buy the 1st 1- to 2-week selloff.
- Tight bull channels constantly form wedge tops, but most lead to minor reversals (bull flags).
- The 2 consecutive inside bars (ii pattern) from 5 days ago, is a possible Final Bull Flag, which is a magnet below.
Overnight EURUSD Forex trading on 5-minute chart
- Rallied in Small Pullback Bull Trend overnight. Day traders have only been buying.
- Mostly sideways for 5 hours, so many bulls have switched to buying for scalps, instead of for swing trades.
- Day traders are only buying.
- They will only start to sell for scalps after there has been at least a 20-pip pullback. They will only scalp since a trend down is unlikely.
Summary of today’s S&P Emini futures price action and what to expect tomorrow

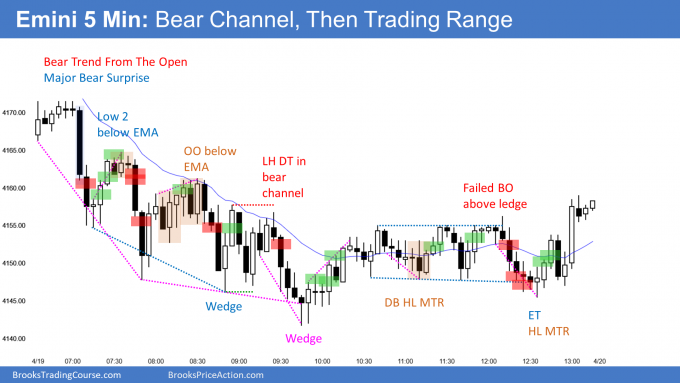
Here are several reasonable stop entry setups for today. I show each buy entry with a green rectangle and each sell entry with a red rectangle. Buyers of both the Brooks Trading Course and Encyclopedia of Chart Patterns have access to a much more detailed explanation of the swing trades for each day (see Online Course/BTC Daily Setups).
My goal with these charts is to present an Always In perspective. If a trader was trying to be Always In or nearly Always In a position all day, and he was not currently in the market, these entries would be logical times for him to enter.
If the risk is too big for your account, you should wait for trades with less risk or trade an alternative market like the Micro Emini.
End of day summary
- Bear Trend From The Open, and Spike and Channel Bear Trend.
- Broke below 60-minute EMA (not shown).
- Bulls made money beneath every prior low for the 1st half of the day. Also, there were many big bull bars. These were signs that the selloff was not a strong bear trend.
- After a couple attempts at a wedge bottom, bulls got a Midday Trend Reversal up.
- There was a higher low major trend reversal. It was after a wedge bottom so it was also a Head and Shoulders bottom.
- This ended the bear trend, but it did not begin a bull trend.
- Instead, the bear channel evolved into a trading range.
- Today was the 3rd bear day in the past 4 days, after 13 consecutive bull days. This was more profit taking.
- Profit taking after an extreme buy climax is a sign that the Emini might have a hard time going much higher for several months. It increases the chance of a trading range. The bottom of the range might be 10% or more down from the high.
- Emini could go a little higher before probing down to find the bottom of the range.
See the weekly update for a discussion of the price action on the weekly chart and for what to expect going into next week.
Trading Room
Traders can see the end of the day bar-by-bar price action report by signing up for free at BrooksPriceAction.com. I talk about the detailed S&P Emini futures price action real-time throughout the day in the BrooksPriceAction.com trading room. We offer a 2 day free trial.
Charts use Pacific Time
When I mention time, it is USA Pacific Time (the Emini day session opens at 6:30 am PT, and closes at 1:15 pm PT). You can read background information on the intraday market reports on the Market Update page.


In the end of the day summary, Al talks about the 60EMA. I understand the purpose of 21EMA, of not of the 60EMA. Are the 60 EMA and the 100 EMA (or 200EMA) explained in of his courses? And if not, can he make a lecture of this topic?
Thanks in advanc.
Regards,
René
Hi Rene,
You can read Al’s post on site here at: “Learn to Trade/My setup”.
Topic is also covered in video #4 of the course, called (again) “My setup”.
Thanks!!!
60EMA : The 20 EMA of the hourly chart
21EMA : Al uses 20 ema
Dear Al,
Was it reasonable to sell bar 6 ii? (I don’t see your setup there). I saw it as a bear flag with two legs reversal up from bar 1 and also the gap of bar 82 on Friday. It might possibly be final flag and another leg up to EMA (2-3 more bars TBTL). I took the chance and put my protective stop a little higher above and luckily had the surprise bar 7.