Emini and Forex Trading Update:
Tuesday April 14, 2020
I will update again at the end of the day.
Pre-Open market analysis
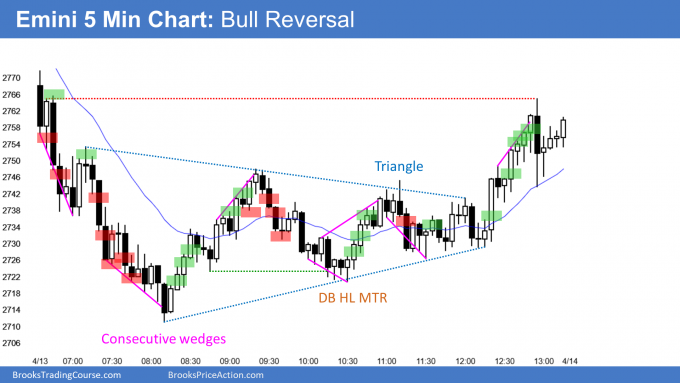
The Emini yesterday formed a triangle on the 5 minute chart. That is a Breakout Mode pattern. There was a small bull breakout at the end of the day and it continued overnight.
Yesterday is a High 1 bull flag buy signal on the daily chart. Because it was a small bear doji candlestick, it is a weak signal bar. However, the rally on the daily chart has been strong. Traders expect at least a slightly higher prices before a 2 – 3 week test down to the April 1 higher low begins.
The Emini tested near the 2706 level again yesterday, but reversed up. That is 20% down from the high. If the Emini trades below it, the Emini will once again be back in a bear market. Regardless of whether it is above or below, it will probably be mostly sideways for several months.
Possible wedge lower high
As strong as the rally has been, today will be the 3rd leg up on the daily chart. Consequently, the rally will be a wedge pullback in a bear trend.
If the bears get a reversal down within a few days from above Thursday’s high, the bulls will start to take profits and the bears will sell more aggressively. Traders will expect a couple legs down to the April 1 higher low over the following few weeks.
The bulls want a strong break above Thursday’s high. That is also last week’s high. If they get it, traders will then expect the rally to continue up to the March 3 lower high before there is a 2 – 3 week selloff.
That March 3 high was the start of the parabolic wedge sell climax. It is a customary magnet for the 1st reversal up. Since it is so far above the low, it is more likely that the Emini will test down to the April 1 low before rallying to the March 3 high.
Overnight Emini Globex trading
The rally on the daily chart has been strong. Traders expect it to continue to above Thursday’s high either today or later this week.
The Emini is up 40 points in the Globex session. It is now testing the 2800 Big Round Number.
However, it has been sideways for most of the session. Furthermore, the rally has not yet broken above last week’s high. Therefore, this week is still an inside bar on the weekly chart.
If the bears continue to prevent a break above last week’s high, the bulls will be disappointed. They will then begin to sell out of their longs either above this week’s high or below this week’s low. Traders will then begin to think that a 2 – 3 week selloff to the April 1 higher low has begun.
But the 4 week rally is probably a bull leg in a trading range on the daily chart. Traders therefore believe that there will soon be a test down to the April 1 higher low. That increases the chance of a surprisingly big bear day within the next week or so.
However, rallies often end with buy climaxes. Therefore, there is also an increased chance of a big bull day at some point this week.
Yesterday’s setups

Here are several reasonable stop entry setups from yesterday. I show each buy entry with a green rectangle and each sell entry with a red rectangle. I rarely also show limit order entries and entries on the close of bars. Buyers of the Brooks Trading Course and Encyclopedia of Chart Patterns have access to a much more detailed explanation of the swing trades for each day (see Online Course/BTC Daily Setups).
My goal with these charts is to present an Always In perspective. If a trader was trying to be Always In or nearly Always In a position all day, and he was not currently in the market, these entries would be logical times for him to enter.
If the risk is too big for your account, you should wait for trades with less risk or trade an alternative market like the Micro Emini.
EURUSD Forex market trading strategies

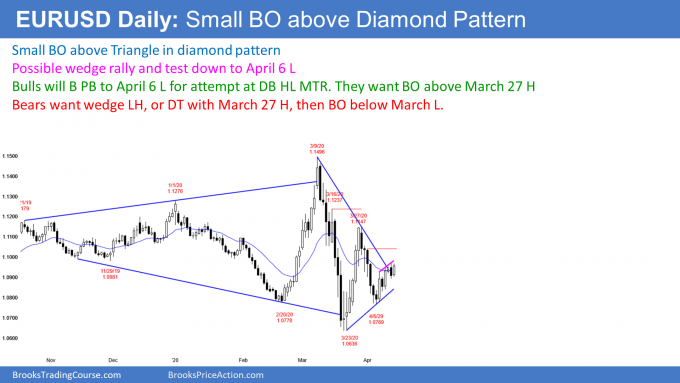
The daily chart of the EURUSD Forex market broke above last week’s high yesterday. That triggered a weekly buy signal. It is also breaking above the bear trend line of a month-long triangle and a 7 month diamond pattern.
But so far the breakout is small. Furthermore, the rally might be forming a small wedge. If there is a reversal down this week, traders will expect a test of the April 6 higher low.
At the moment, the EURUSD is likely to go at least a little higher. If today closes far above yesterday’s high, today will probably be a measuring gap. That gap would be between today’s close and yesterday’s high. It would increase the chance of a measured move up to the March 27 lower high.
Overnight EURUSD Forex trading
The 5 minute chart of the EURUSD Forex market has rallied overnight to above yesterday’s high. If the rally continues all day, traders will conclude that the breakout on the daily chart is strong. They will then expect it to continue up to the March 27 high. Consequently, there is an important incentive for the bulls.
But so far the rally has not been particularly strong. The bars have been small and most have prominent tails. When a rally looks like that, it typically evolves into a trading range.
Unless the bulls start to get bigger bull bars and more bars closing on their highs, traders will expect the overnight bull trend to transition into a trading range. Once there is a 20 – 30 pip pullback, the bears will begin to sell rallies. Until then, day traders will continue to look to buy small pullbacks.
Summary of today’s S&P Emini futures price action and what to expect tomorrow

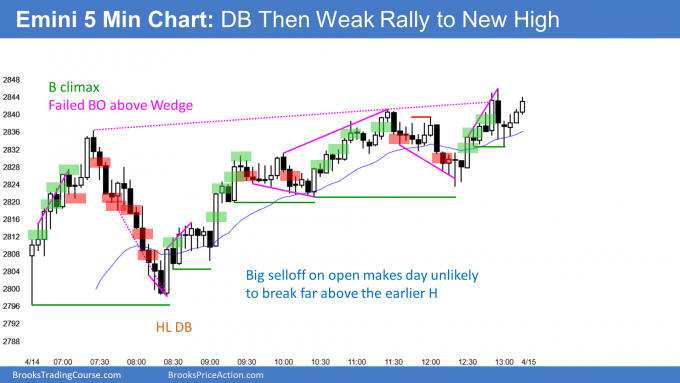
Here are several reasonable stop entry setups for today. I show each buy entry with a green rectangle and each sell entry with a red rectangle. I rarely also show limit order entries and entries on the close of bars. Buyers of the Brooks Trading Course and Encyclopedia of Chart Patterns have access to a much more detailed explanation of the swing trades for each day (see Online Course/BTC Daily Setups).
My goal with these charts is to present an Always In perspective. If a trader was trying to be Always In or nearly Always In a position all day, and he was not currently in the market, these entries would be logical times for him to enter.
If the risk is too big for your account, you should wait for trades with less risk or trade an alternative market like the Micro Emini.
End of day summary
The Emini sold off sharply from a parabolic wedge buy climax on the open. However, it then reversed back up to the high of the day.
The 4 week bull trend will probably continue up to the March 10 lower high. That is also around the 50 day simple moving average, which is also a magnet. A reversal down from there or from here would be from a wedge rally. Traders would then expect a 2 – 3 week pullback to the April 1 low.
There is no top yet and there are magnets above. Consequently, the Emini probably will work higher until it reaches those targets. But the bears are likely beginning to scale into shorts since they expect a reversal soon.
See the weekly update for a discussion of the price action on the weekly chart and for what to expect going into next week.
Trading Room
Traders can see the end of the day bar-by-bar price action report by signing up for free at BrooksPriceAction.com. I talk about the detailed S&P Emini futures price action real-time throughout the day in the BrooksPriceAction.com trading room. We offer a 2 day free trial.
Charts use Pacific Standard Time
When I mention time, it is USA Pacific Standard Time (the Emini day session opens at 6:30 am PST, and closes at 1:15 pm PST). You can read background information on the intraday market reports on the Market Update page.
Hi Al,
Thanks for your daily report. I am a beginner who started trading for a month and found it was hard to trade for me since last Thursday. I have some observations on this changes. Don’t know whether you agree or not.
1. Wedge is no longer obvious. Previously I will wait for wedge top/bottom to form and then several bars to confirm (like forming double top/double bottom) then enter the market. But I found these few days the market seldom forming a clear top/bottom. When I entered the market, it soon reverse up/down and hit my stop loss.
2. Few buy/sell climax. Another way I trade in the past few weeks was to see whether there is any climax and wait for DT/DB to do reversal. But seems there are less buy/sell climax which makes me less certain on the entering the market and losing the chance of enter.
3. Market has more sideway bars with long tail on top and bottom makes market without a clear direction.
Do you have similar feeling on it?
Your observations are accurate. That means your radar is good enough to tell you when the market is in a trading range. Rather than being frustrated, don’t fight it. Simple do what is necessary to make money in a trading range environment. There are fewer and smaller opportunities for beginners, but there are still several every day.
When the market is trending, signals are mostly clear. When the market has a lot of trading range trading, things are not clear. They cannot be because if they were, there would be a trend. Everyone would agree on the direction.
Unclear markets have to go sideways because no one believes a trend is underway. Therefore, traders take quick profits. That creates lots of reversals. Many trade with limit orders, betting on failed stop entries. They buy low and many scale in lower. They sell high and many scale in higher.
That is fine for experienced traders. Beginners should instead just patiently wait for decent stop entry setups. There are several every day, but fewer than when the market is trending.
Thanks much for your reply!
Could you describe more on how to trade when market behaves like this? I have watched your video but my understanding on trading in trading range is still not so clear.
For example, for the period 9:20 to 10:15 PST, I could draw a wedge after the wedge was formed. But before it was formed, 9:55 made me think it was a double top and expecting going down. I would enter at the low of 10:00 bar and expect the reverse up in the following two bars are minor one and start expect a wedge starting from 10:00 bar. I didn’t expect the wedge started from 9:25/9:30 was because the leg up at 9:50 was so strong that it didn’t look like a wedge but like a double top. When 10:20 strong bar up we all knew that it was the end of wedge from 9:25.
What I would like to know is when I face market like this, how should I prevent falling into losing trade like this? And if I entered, how should I set my stop gain? (I only know I should set my stop loss above top of 9:55…)
Hi Jeffrey,
Sorry to say but post comments are not the place for extended trading discussions. Also, Al really does not have time to get involved as he is so busy doing all the other stuff he handles every day. Trust you understand.
Given your limited time trading, be very careful and keep going through the course videos. You will gain insight as trading knowledge gets embedded in your head. Trade small, or even on simulator until you have mastered basic trading skills. As Al noted, your ‘radar’ is working fine so keep at it. Success will come.
This is noted! Thanks for your reply and encouragement!
Check the bar-by-bar at BrooksPriceAction.com for some help answering your questions.