Emini and Forex Trading Update:
Tuesday April 30, 2019
I will update again at the end of the day.
Pre-Open market analysis
The Emini yesterday continued Friday’s weak rally until late. It then reversed down to close near the open and low. Yesterday became a bear trend reversal day on the daily chart. Consequently, it is a sell signal bar for today.
But, it was a bull doji bar and the daily chart is in a tight bull channel. This is therefore a minor sell setup. The best the bears will probably get is a 2 – 3 week, 2 – 3% pullback, like the other pullbacks in the past 4 months.
While the correction might begin today, today will likely be quiet ahead of tomorrow’s FOMC announcement. Most days over the past month have had at least one swing up and one swing down. There is no strong reason to expect otherwise today.
Traders are confident of a new all-time high. What they do not know is if it will come before tomorrow’s FOMC announcement, immediately afterwards, or a few weeks later.
It is important to note that today is the final day of the month. That increases the chance of a surprise move up or down, especially in the final hour.
Overnight Emini Globex trading
The Emini is down 1 point in the Globex session. If it opens here, it will be just above yesterday’s low. That would make a break below yesterday’s low likely. Because the Emini is in a buy climax and at a major prior high, there is an increased chance of a big move up or down today.
Even though trading below yesterday’s low would trigger a sell signal on the daily chart, the sell setup is weak. Consequently, there will probably be more buyers than sellers below yesterday’s low. This is especially true with tomorrow’s important catalyst. The Emini typically does not have a big move just ahead of a catalyst.
Since today is the last day of the month, there is an increased chance of a sharp move up or down in the final hour.
Yesterday’s setups

Here are several reasonable stop entry setups from yesterday. I show each buy entry with a green rectangle and each sell entry with a red rectangle. I rarely also show limit order entries and entries on the close of bars. Buyers of the Brooks Trading Course have access to a much more detailed explanation of the swing trades for each day.
My goal with these charts is to present an Always In perspective. If a trader was trying to be Always In or nearly Always In a position all day, and he was not currently in the market, these entries would be logical times for him to enter.
EURUSD Forex market trading strategies

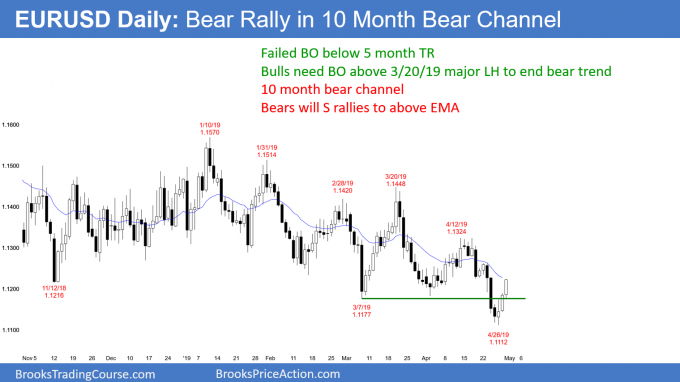
The EURUSD daily Forex chart has reversed up for 3 days after breaking below a 5 month trading range. But, it has been in a bear channel for 10 months. There have been many new lows and some minor new highs. However, as long as the chart continues to make lower highs and lows, it is still in a bear trend.
The bulls need a break above a major lower high. They then need a higher low, and then another new high. In addition, they need a break far above that major lower high. The most recent major lower high is the March 20 high of 1.1448.
Even if the bulls accomplish all of this, that simply ends the bear trend. It does not necessarily begin a bull trend. More often, it converts the bear trend into a trading range. At that point, the bulls will need a major trend reversal buy setup and a successful break above the trading range before traders will conclude that a bull trend has begun.
Therefore, traders will assume that this rally is a bull leg in the bear channel. There have been many other similar rallies. Each has lasted 2 – 3 weeks. Consequently, traders will assume that this rally will fail within a couple weeks at around the April 12 lower high of 1.1324.
Tomorrow’s FOMC announcement is a possible catalyst for a surprisingly big move up or down. However, it will unlikely not be enough to break above the March 20 lower high.
Overnight EURUSD Forex trading
The EURUSD 5 minute Forex chart rallied 50 pips overnight after yesterday’s reversal up from below the 5 month trading range low. The rally is now testing the 20 day EMA. Because the pullbacks for the past 6 hours have been small, day traders could only make money by buying.
While the pullbacks have been small, the rally over the past 2 hours has had small bars will prominent tails. That is a sign of loss of momentum. It increases the chance of an evolution into a trading range.
If the rally begins to evolve into a trading range, day traders will start to sell for scalps in addition to buying. However, a tight bull channel typically does not convert into a bear trend without 1st entering a trading range for 20 or more bars. As a result, it will be easier to make money focusing on buy setups today until the bears can get at least one 30 pip reversal.
Summary of today’s S&P Emini futures price action and what to expect tomorrow

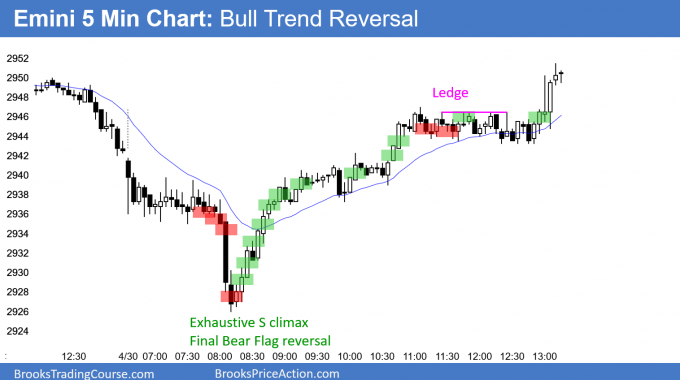
Here are several reasonable stop entry setups for today. I show each buy entry with a green rectangle and each sell entry with a red rectangle. I rarely also show limit order entries and entries on the close of bars. Buyers of the Brooks Trading Course have access to a much more detailed explanation of the swing trades for each day.
My goal with these charts is to present an Always In perspective. If a trader was trying to be Always In or nearly Always In a position all day, and he was not currently in the market, these entries would be logical times for him to enter.
End of day summary
By breaking below yesterday’s low, the Emini triggered a sell signal on the daily chart. Since it was a weak signal, there were likely to be more buyers than sellers below, and there were.
The Emini broke strongly below an early trading range, which became the Final Bear Flag on the 5 minute chart. The strong bear breakout was a bear trap and an exhaustive sell climax. The Emini reversed up to a new high, and the rally stop exactly at yesterday’s high. It was therefore almost an outside up day and it is now a buy signal bar for tomorrow.
Tomorrow is an FOMC announcement day. The Emini is in a buy climax on the daily chart at the all-time high. As a result, there is an increased chance of a big move up or down after the 11 am PST report tomorrow.
See the weekly update for a discussion of the price action on the weekly chart and for what to expect going into next week.
Trading Room
Traders can see the end of the day bar-by-bar price action report by signing up for free at BrooksPriceAction.com. I talk about the detailed S&P Emini futures price action real-time throughout the day in the BrooksPriceAction.com trading room. We offer a 2 day free trial.
Charts use Pacific Standard Time
When I mention time, it is USA Pacific Standard Time (the Emini day session opens at 6:30 am PST, and closes at 1:15 pm PST). You can read background information on the intraday market reports on the Intraday Market Update page.
Al,
With the Emini just breaking above the all time high in the after hours session does that change your outlook with a possible buy climax and wedge top (that started today at around bar 20) and is at resistance?
I guess without looking back to see the prior all-time high, today is just an ordinary bull reversal day – failed to break down the 18-bar range, and half-half from OOD to LOD and from OOD to HOD. And Al has been saying very clearly the all-time high will be reached since the bears cannot create strong sell-offs. And also, buy climax and wedge tops do not necessarily just go ahead and reverse themselves down. They can just go trading ranges, flags for some time and keep breaking up. The fact that they keep breaking up does not change the fact that they are buy climax and wedge tops, if I understand it correctly.
I have been saying since December that the Emini looks like it would go higher. I expected a credible top at around 2800, but one never materialized. Until one does, I continue to expect the rally to continue. In addition, I have been saying since late January that the bulls will buy the 1st selloff, even if it is deep. That is still true.
If you are in the chat room, you might have heard me say several times lately that the 60 minute chart keeps testing the top of a tight bull channel. I said when that is the case, there is usually a bull breakout above the bull channel. But, it will probably be a blow-off top. That is a surprisingly strong breakout above the bull channel that quickly reverses. The bulls will see the breakout as a brief opportunity to take windfall profits. Many will. If they take profits, they will not rush back in. They want to see how far down the profit taking will go. They also want to see evidence that the rally is about to resume.
A reversal from a buy climax usually does not lead to a bear trend, although it sometimes does. You can read my posts in January 2018 when I said that the buy climax would probably reverse down 5 – 10% within a few weeks. It fell 10% in February 2018.
More often, when there is a reversal from a buy climax, it results in a temporary halt to the bull trend. That means a trading range. After about 10 bars and 2 legs down, the bulls begin to consider buying again. If there is no stabilization, they continue to wait. This can result in a protracted trading range or a very deep retracement.
The daily and weekly charts are strongly bullish. Even if there is a 50% retracement of the 4 month rally, the bulls will buy it. The odds are that the high will again get tested, even after a deep pullback. I have been writing for several months that the bulls will buy any selloff and therefore any selloff will be minor. This is still the case.