Emini and Forex Trading Update:
Tuesday October 20, 2020
I will update again at the end of the day.
Pre-Open market analysis
By trading below Friday’s low, the Emini triggered a sell signal on the daily chart. By trading below last week’s low, it triggered a double top sell signal on the weekly chart. But that weekly sell setup is not strong since last week’s candlestick had a prominent tail below and it followed 3 bull bars.
I wrote over the weekend that the Emini would probably fall below the September 16 high, which was the breakout point of the rally 2 weeks ago. It reached that target yesterday.
What will happen next? Will the Emini resume up to last week’s high and possibly form a wedge top and a double top, like I discussed over the weekend? Or, have the bears taken control and has a double top reversal down begun?
We will find out this week. If there are 2 or 3 consecutive big bear days, the Emini would probably be reversing down from the double top. If so, this could be the start of a selloff that could last a month or two. But if there is a reversal up in the next couple days, the Emini will probably test last week’s high. Since trends resist reversing, the bull case is slightly more likely
Overnight Emini Globex trading
The Emini is up 15 points in the Globex session. However, that is not much, given how big the selloff and bars were at the end of yesterday. If there is a gap up, it will be relatively small. Small gaps usually close in the 1st hour or two, which means the Emini might test yesterday’s close.
Yesterday ended with a sell climax. There is a 50% chance of some follow-though selling on the open, but only a 25% chance of a 2nd consecutive big bear day.
The bears will probably take some profits today. That typically leads to at least a couple hours of sideways to up trading that begins by the end of the 2nd hour.
Can today completely reverse yesterday’s selloff? Probably not in one day. However, the Emini is at the important support of the September 16 high. Traders this week will therefore look for either a reversal up or a strong break below. The reversal up is slightly more likely because of the strong 4-week rally into early October.
Yesterday’s setups

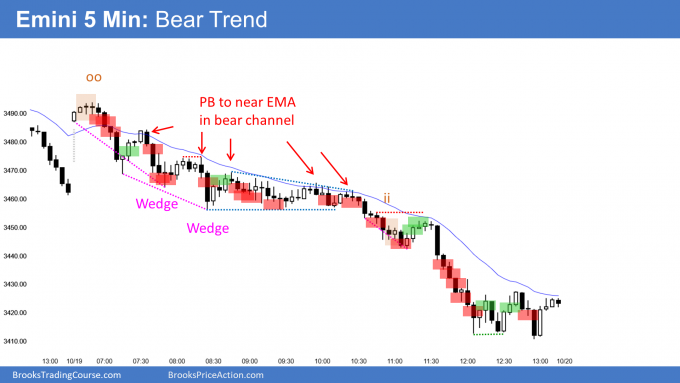
Here are several reasonable stop entry setups from yesterday. I show each buy entry with a green rectangle and each sell entry with a red rectangle. I rarely also show limit order entries and entries on the close of bars. I do not want the lines to be distracting. If they are longer, I make them dotted. But, they have to be visible, so I make the shorter ones solid. Buyers of both the Brooks Trading Course and Encyclopedia of Chart Patterns have access to a much more detailed explanation of the swing trades for each day (see Online Course/BTC Daily Setups).
My goal with these charts is to present an Always In perspective. If a trader was trying to be Always In or nearly Always In a position all day, and he was not currently in the market, these entries would be logical times for him to enter.
If the risk is too big for your account, you should wait for trades with less risk or trade an alternative market like the Micro Emini.
EURUSD Forex market trading strategies

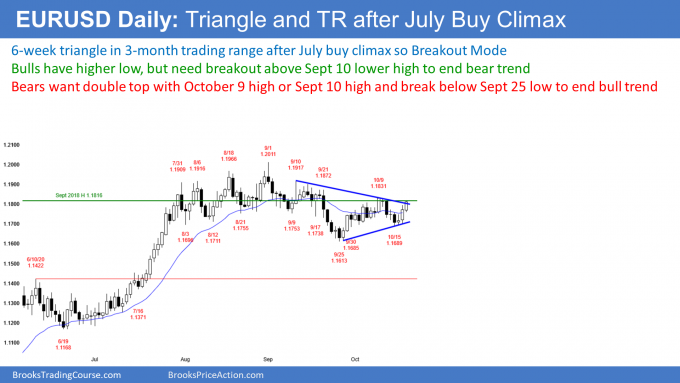
The EURUSD Forex market on the daily chart has been sideways for 4 months after a strong summer rally. A triangle has formed over the past 6 weeks. It does not matter what you call it. All that is important is that the chart is sideways around the September 2018 high with the bulls and bears alternating control every week or two.
Every trading range is also both a bull and bear trend. This is a Breakout Mode pattern. Traders believe the market is balanced and that there is about a 50% chance of either a successful bull or bear breakout.
A bear trend needs lower highs. If the bulls get a break above the September 10 high, traders would stop thinking that there is a bear trend.
A bull trend needs higher lows. If the bears get a break below the September 25 low, traders would stop thinking that the EURUSD is still in a bull trend.
The EURUSD is now at the September 2018 high, which has been resistance for 4 months. Furthermore, there have not been more than 2 strong bull days since August. Therefore, the 2-day rally might stall tomorrow instead of continuing straight up to test the September 10 high.
Overnight EURUSD Forex trading
The 5-minute chart of the EURUSD Forex market overnight continued yesterday’s rally. Day traders have only been buying. However, the EURUSD is now back at the September 2018 high, which has been the most important price for 4 months. Consequently, the 2-day rally will probably begin to stall today or tomorrow.
But until there is a 20 – 30-pip pullback, day traders will continue to only look to buy. Because the daily chart is now at resistance, the bulls will start to take profits. This should create a 20 – 30-pip pullback today. If it does, day traders will begin to sell reversals down from prior highs for scalps, in addition to looking for buys.
Summary of today’s S&P Emini futures price action and what to expect tomorrow

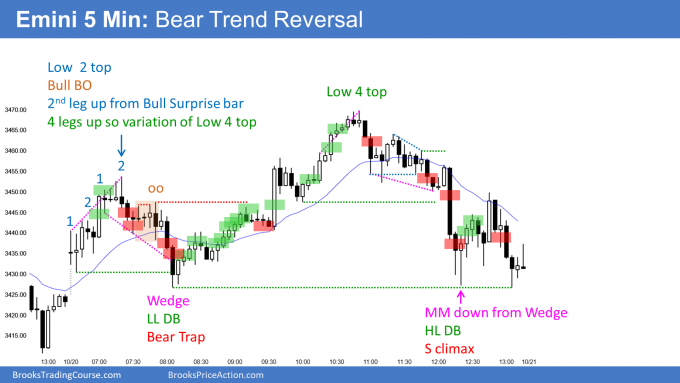
Here are several reasonable stop entry setups for today. I show each buy entry with a green rectangle and each sell entry with a red rectangle. I rarely also show limit order entries and entries on the close of bars. I do not want the lines to be distracting. If they are longer, I make them dotted. But, they have to be visible, so I make the shorter ones solid. Buyers of both the Brooks Trading Course and Encyclopedia of Chart Patterns have access to a much more detailed explanation of the swing trades for each day (see Online Course/BTC Daily Setups).
My goal with these charts is to present an Always In perspective. If a trader was trying to be Always In or nearly Always In a position all day, and he was not currently in the market, these entries would be logical times for him to enter.
If the risk is too big for your account, you should wait for trades with less risk or trade an alternative market like the Micro Emini.
End of day summary
The Emini today rallied for the 1st half of the day, but sold off to a new low in the 2nd half. It closed near the open and formed a doji inside day on the daily chart. That is a weak buy and sell signal bar for tomorrow.
The 5-day selloff might be strong enough to make traders wait for a 3rd leg down. The cash index did not quite reach the February high, which has been an important magnet. Consequently, the Emini might have to fall a little further before the bulls will return.
Since yesterday was a big bear day closing on its low, today was not a strong follow-through day for the bears. It is still slightly more likely that there will be one more push up before there is a test down to the September low.
See the weekly update for a discussion of the price action on the weekly chart and for what to expect going into next week.
Trading Room
Traders can see the end of the day bar-by-bar price action report by signing up for free at BrooksPriceAction.com. I talk about the detailed S&P Emini futures price action real-time throughout the day in the BrooksPriceAction.com trading room. We offer a 2 day free trial.
Charts use Pacific Standard Time
When I mention time, it is USA Pacific Standard Time (the Emini day session opens at 6:30 am PST, and closes at 1:15 pm PST). You can read background information on the intraday market reports on the Market Update page.
Can anyone confirm the symbol for the S&P 500 Cash Index? Is it SPX? Thank you!
Every charting program and broker has its own. In TradeStation, it is $INX.
SPX in Thinkorswim and Interactive brokers.
I use $SPX.X in Tradestation. I don’t think I have the subscription for $INX.
First sentence of the very last section needs a fix. Yesterday was a big bear day closing near its low.
Good. I fixed it.
Thanks,
Al