Emini testing September all time high before unemployment report
I will update again at the end of the day.
Pre-Open market analysis
The Emini gapped up yesterday, but then enter a triangle. There was a trend reversal down at the end of the day. While yesterday is a sell signal bar on the daily chart, it has a prominent tail below. Furthermore, the 2 week tight trading range reduces the chances of a bear trend today.
The Emini is deciding between a reversal down from below the September high or one more new high. If there is a new high, there will probably be a wedge top and then a reversal down.
The daily, weekly, and monthly charts are in bull trends. But, the weekly chart is overbought and the rally is stalling just above the January high resistance. This makes a pullback to the 20 week EMA increasingly likely. If the bears get their pullback, it will probably only last 2 – 3 weeks, like all of the other pullbacks in 2018.
Most of the days over the past 3 weeks have prominent tails on the daily chart. This means that they had reversals and were primarily trading range days. That is likely again today, especially ahead of tomorrow’s unemployment report.
Overnight Emini Globex trading
The Emini is down 13 points in the Globex session. With each of the past 5 days having reversals, the odds favor at least one reversal today. This is especially true ahead of tomorrow’s unemployment report.
Today will probably gap down below the trend line from the June 28 and August 15 low. The bulls want it to be support and will try to create a reversal up.
When there is a big gap, there is only a 20% chance of a big trend day up or down. When the gap is down, like today, if there is a trend, down is more likely.
In 80% of days with big gaps, the Emini usually enters a trading range for the 1st 30 – 90 minutes. The bears typically try to create a wedge bear flag or double top at the EMA. The bulls want a double bottom or a wedge bottom.
Yesterday’s setups
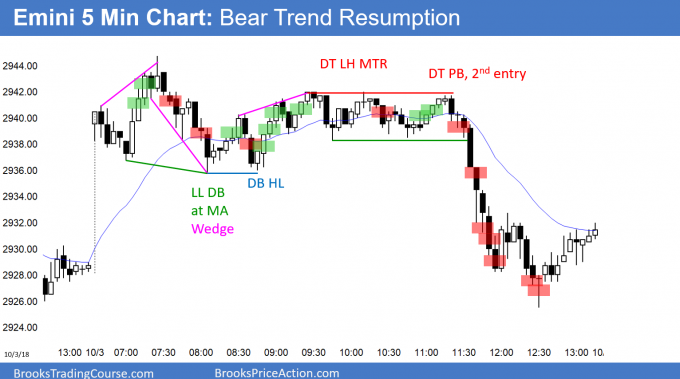
Here are several reasonable stop entry setups from yesterday. I show each buy entry with a green rectangle and each sell entry with a red rectangle. I rarely also show limit order entries and entries on the close of bars. My goal with these charts is to present an Always In perspective. If a trader was trying to be Always In or nearly Always In a position all day, and he was not currently in the market, these entries would be logical times for him to enter.
EURUSD Forex market trading strategies
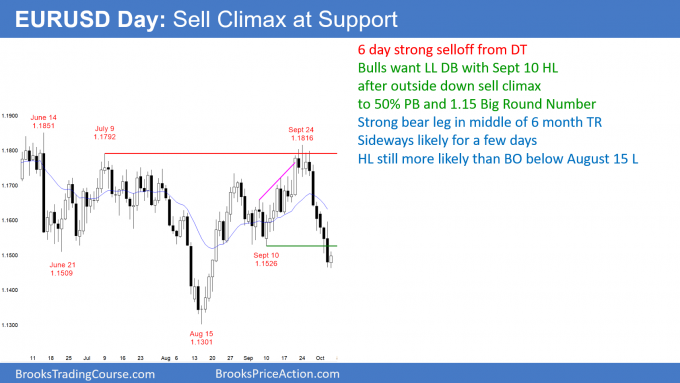
The EURUSD daily Forex chart sold off strong for 6 days and is now at the support of the September 10 low, the 1.15 Big Round Number, and a 50% pullback. Yesterday was a big outside down day and therefore a sell climax at support.
The EURUSD daily Forex chart is in a sell climax down to support. Yesterday’s huge outside down day is probably an exhaustive end of the selling for the next week or two. But, there might be one more minor low after tomorrow’s unemployment report.
The bears want the selloff to be a reversal down from a double top with the July 9 high. There is a 40% chance that a strong selloff from a double top will break below the neck line and fall for about a measured move down. Therefore, there is a 60% chance that it will not, even if there is a small break below the August 15 low, which is the neck line.
In this particular case where the market reversed up strongly from a Final Bear Flag on the weekly chart, there is a 60% chance that this selloff will form a higher low. But, if it begins to form lower highs, the probability of a successful breakout below the August low will go up.
Sell climax at support
Since yesterday was probably a sell vacuum down to support, the bears are exhausted. They will therefore take profits, and switch to selling rallies from selling at the market. This will probably create a 150 pip tall trading range over the next week. The 1st target for the bulls is always the top of the most recent sell climax, which is yesterday’s high.
When a selloff is strong like this one, the bulls typically need at least a small double bottom before they can get a big reversal up. Consequently, the daily chart will probably go sideways for at least a week.
Overnight EURUSD Forex trading
The EURUSD 5 minute Forex chart reversed up overnight from below yesterday’s low. The exhausted bears are taking profits and will look to sell higher. Furthermore, they know there is support around yesterday’s low. This will make them take profits on selloffs near that low.
The bulls also know that the bears will switch to selling rallies and buying around prior lows. They therefore will buy around prior minor lows and take profits on rallies. With both the bulls and bears buying low and selling high, the 5 and 60 minute charts will begin to form a trading range.
Summary of today’s S&P Emini futures price action and what to expect tomorrow
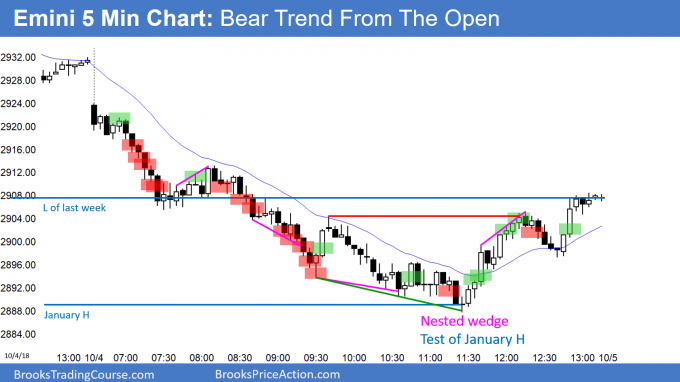
Here are several reasonable stop entry setups for today. I show each buy entry with a green rectangle and each sell entry with a red rectangle. I rarely also show limit order entries and entries on the close of bars. My goal with these charts is to present an Always In perspective. If a trader was trying to be Always In or nearly Always In a position all day, and he was not currently in the market, these entries would be logical times for him to enter.
The Emini had a big bear trend day today. It finally broke below the 5 month bull trend line. However, it was a big enough bear today to make follow-through selling likely over the next 1 – 2 weeks. This is true even if tomorrow rallies after the unemployment report.
After the strong reversal up at the end of the day, the bulls are hoping that today was just a sell vacuum test of the January high. Tomorrow might even rally back above last week’s high. This week would then be both and outside down and an outside up week. That would be a sign of strong bulls. Since the weekly chart is overbought and this week is now an outside down week, the odds favor lower prices next week. But, tomorrow’s unemployment report could significantly change the appearance of the weekly chart.
See the weekly update for a discussion of the price action on the weekly candlestick chart and for what to expect going into next week.
Trading Room
Traders can see the end of the day bar-by-bar price action report by signing up for free at BrooksPriceAction.com. I talk about the detailed S&P Emini futures price action real-time throughout the day in the BrooksPriceAction.com trading room. We offer a 2 day free trial.
Charts use Pacific Standard Time
When I mention time, it is USA Pacific Standard Time (the Emini day session opens at 6:30 am PST, and closes at 1:15 pm PST). You can read background information on the intraday market reports on the Intraday Market Update page.


Watching this morning’s open, with the tail below, bar 7 (or even bar 6) appeared that it could be a wedge with bars 1 and 2. Obviously there was never a bull bar to buy above, but at what point could I have concluded that any potential wedge had failed and it was OK to sell below?
Strong trends often do things to make traders not enter. That is an example. One of my general rules is that when there are 3 consecutive bear bars at a time when I think there should not be, then I change my mind and start selling. Or, I wait for a pullback to sell.