Emini and Forex Trading Update:
Friday October 25, 2019
I will update again at the end of the day.
Pre-Open market analysis
The Emini yesterday triggered a buy signal on the daily chart. However, the day went sideways and formed another trading range day. It closed below its midpoint and it is therefore a sell signal bar for tomorrow.
But there have been several weak buy and sell signals on the daily and weekly chart for several weeks. None led to a successful breakout. The Emini is in an 8 day and an 8 week tight trading range. This is a Breakout Mode pattern.
The bulls want October to trade above September. It would then be an outside up month. Furthermore, they want the month to close above September’s high and at a new all-time high. Even if they do not get the new high next week, there will probably be a new high within a few weeks.
Part of the hesitation is due to next week’s FOMC announcement. While everyone agrees that the Fed will cut rates, traders are uncertain about what the Fed will say. Will they say that they plan more cuts or will this be the last one for a long time? In either case, the announcement will probably lead to a new all-time high or a quick reversal down to the gap above the October 19 high.
Overnight Emini Globex trading
The Emini is down 2 points in the Globex session. Since yesterday was another sell signal bar on the daily chart, the bears will try to get today to trade below yesterday’s low to trigger the daily sell signal.
But all daily buy and sell signals over the past 2 weeks failed. In addition, yesterday’s bear bar on the daily chart had a prominent tail below. This is therefore a weak sell setup on the daily chart. That reduces the chance of a big bear trend day.
Today is Friday and therefore day traders will consider weekly support and resistance today. This is especially true in the final hour. The week so far is a small doji bar on the weekly chart.
The bulls want a bull body. They therefore will look to buy reversals up from below the open of the week. However, the bears would like a bear bar. This week would then be a better sell signal bar on the weekly chart. They want today to close below the open. In addition, they want as big a bear bar as possible on the weekly chart. There is therefore a slightly increased chance of a bear trend day.
With most days over the past 3 weeks having at least one reversal, day traders will expect at least one today.
Yesterday’s setups

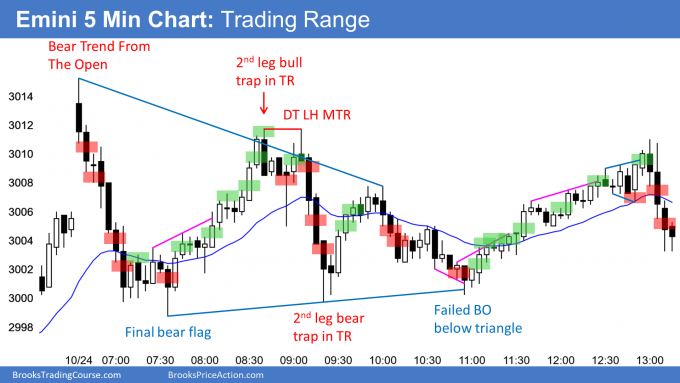
Here are several reasonable stop entry setups from yesterday. I show each buy entry with a green rectangle and each sell entry with a red rectangle. I rarely also show limit order entries and entries on the close of bars. Buyers of the Brooks Trading Course and Encyclopedia of Chart Patterns have access to a much more detailed explanation of the swing trades for each day.
My goal with these charts is to present an Always In perspective. If a trader was trying to be Always In or nearly Always In a position all day, and he was not currently in the market, these entries would be logical times for him to enter.
EURUSD Forex market trading strategies

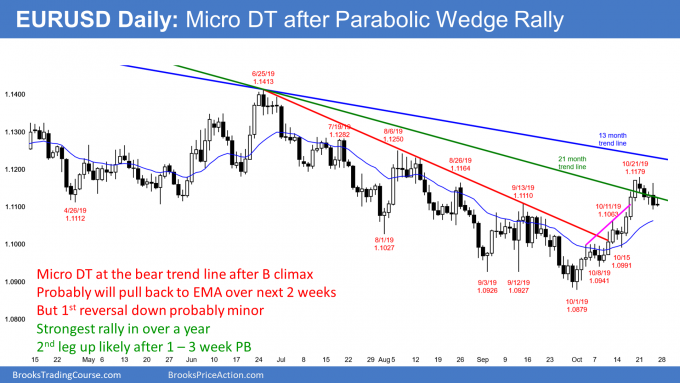
The EURUSD daily Forex chart formed an outside down day yesterday. There is now a micro double top after the parabolic wedge buy climax to the bear trend line. That is the minimum that the bears wanted to begin a 50% pullback to below the EMA.
However, yesterday dd not close on its low and it was not a particularly big bear bar. Consequently, many bulls have not yet given up.
Once there is a big bear bar, traders will see it as a sign that the bulls have given up. They will then expect at least a couple legs down over the next 1 – 2 weeks. The bulls might still be holding for one more push up before a 1 – 3 week pullback. Financial markets might go sideways into next Wednesday’s FOMC announcement, and then break out up or down.
Overnight EURUSD Forex trading
The EURUSD 5 minute Forex chart has been in a 30 pip range overnight. In addition, it has not traded below yesterday’s low. Since yesterday was an outside down bar and a micro double top, it is a sell signal bar on the daily chart. Traders want to know if there will be more buyers or sellers below its low. Therefore, today might go below yesterday’s low.
But the past 4 days have been quiet and yesterday had a prominent tail below. As a result, today will probably not be a big trend day up or down.
This is Friday. Last week was a big bull bar on the weekly chart. This week went a little above last week’s high and is now trading at the low of the week. Traders see this week as a sell signal bar on the weekly chart. The more it closes on its low, the more traders will look to sell next week.
The bear day traders today will sell 20 pip bounces and try to keep the week near its low. They do not need a bigger bear bar than what they already have on the weekly chart so there is less incentive for them to keep selling and trying to create a big bear bar.
The bulls will probably not be able to create a trend up to put a bull body on the weekly chart. However, they will buy reversals up from the low to try to weaken the appearance of the weekly sell signal bar.
Summary of today’s S&P Emini futures price action and what to expect tomorrow
I will post chart after the close.

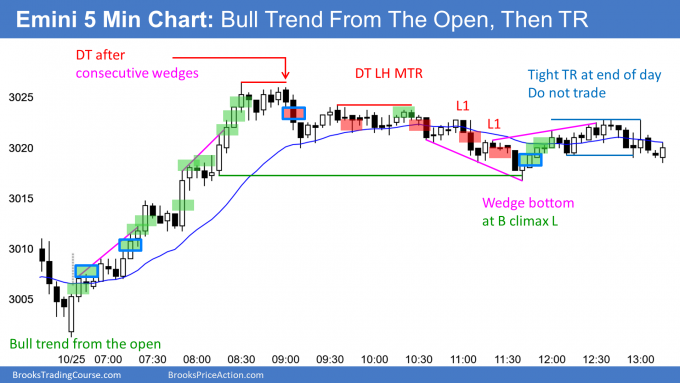
Here are several reasonable stop entry setups for today. I show each buy entry with a green rectangle and each sell entry with a red rectangle. I rarely also show limit order entries and entries on the close of bars. Buyers of the Brooks Trading Course and Encyclopedia of Chart Patterns have access to a much more detailed explanation of the swing trades for each day.
My goal with these charts is to present an Always In perspective. If a trader was trying to be Always In or nearly Always In a position all day, and he was not currently in the market, these entries would be logical times for him to enter.
End of day summary
The Emini rallied strongly on the open in a Bull Trend From The Open. It broke above the September high and stalled. But by going above the September high, October is now an outside up month. That increases the chance of higher prices in November.
As often happens when the Emini breaks above higher time frame resistance, there was a pullback. But there is then usually a 2nd or 3rd attempt to break above that resistance within a couple days. Consequently, the downside is probably not big on Monday.
See the weekly update for a discussion of the price action on the weekly chart and for what to expect going into next week.
Trading Room
Traders can see the end of the day bar-by-bar price action report by signing up for free at BrooksPriceAction.com. I talk about the detailed S&P Emini futures price action real-time throughout the day in the BrooksPriceAction.com trading room. We offer a 2 day free trial.
Charts use Pacific Standard Time
When I mention time, it is USA Pacific Standard Time (the Emini day session opens at 6:30 am PST, and closes at 1:15 pm PST). You can read background information on the intraday market reports on the Market Update page.