Emini weak High 1 bull flag at 2800 triple top
I will update again at the end of the day.
Pre-Open market analysis
Yesterday was a trading range day. On the daily chart, it is a High 1 bull flag and therefore a buy signal bar. Every pullback this year ended after 1 or 2 bars. The bulls hope the bull trend will resume today.
However, the Emini is at strong resistance at 2800 and the triple top on the daily chart. In addition, yesterday was a doji day and not a strong bull trend day. Furthermore, there is a parabolic wedge buy climax.
Monday might be the start of 2 – 3 weeks of profit taking. Consequently, yesterday is not a strong buy setup. There may be sellers above yesterday’s high and above Monday’s high.
How will traders know that a pullback is underway? They will begin to see 2 or more especially big bear bars closing on their lows on the 5 minute chart. In addition, there will be bear trends. Also, there will often be selling in the final 30 minutes.
Finally, the pullback on the daily chart will last 3 or more days. Until then, traders will assume that the 2 month Small Pullback Bull Trend is still in effect.
Overnight Emini Globex trading
The Emini is down 4 points in the Globex session. Since yesterday was a doji bar on the daily chart, it was neutral. Consequently, there will probably be buyers around its low and sellers around its high.
The bears see yesterday as the entry bar for the selloff from resistance above 2800. A doji bar is a weak entry. When that is the case, the bears usually need a micro double top. Therefore, there will probably be a test up this week.
Furthermore, the open of the week is important this week. After 9 bull weeks on the weekly chart, the bulls will try for a 10th. That is another reason for a test up to 2808 today or tomorrow.
Because the 2 day selloff has been weak, the daily chart is in a strong bull trend, and the open of the week is a magnet above, the odds favor sideways to up for at least a day or two.
Yesterday’s setups

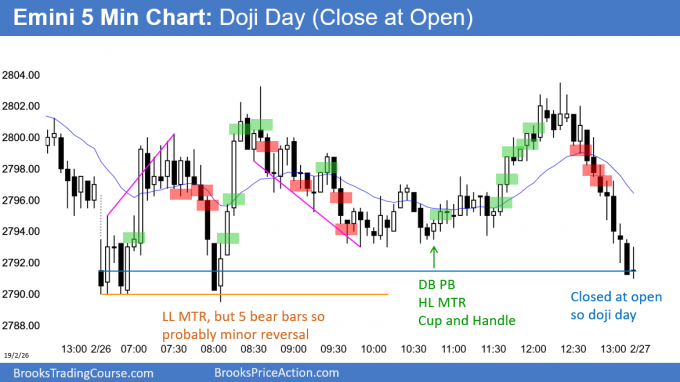
Here are several reasonable stop entry setups from yesterday. I show each buy entry with a green rectangle and each sell entry with a red rectangle. I rarely also show limit order entries and entries on the close of bars. My goal with these charts is to present an Always In perspective. If a trader was trying to be Always In or nearly Always In a position all day, and he was not currently in the market, these entries would be logical times for him to enter.
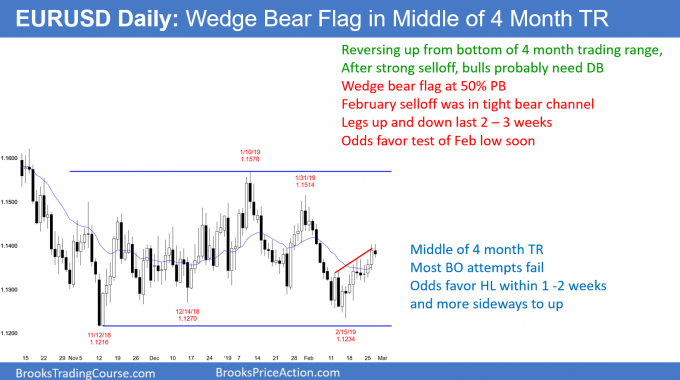
Wedge bear flag in middle of 4 month trading range

The EURUSD daily Forex chart is back to the middle of its 4 month trading range. Legs up and down have lasted 2 – 3 weeks. This leg will probably end soon.
The February selloff was unusually strong. When that is the case, the bear low typically gets tested. Consequently, the daily chart will probably begin retrace at least half of the 3 week rally within a week.
While the February selloff was strong, so were many of the rallies over the past 4 months. Trading ranges always have legs that look like they will begin a trend. But, a hallmark of a trading range is disappointment.
When traders see strong legs repeatedly reversing, they correctly conclude that reversals are more likely than breakouts. As a result, they exit trades within 2 – 3 weeks and look for a trade in the opposite direction. That will probably happen within the next few days.
The daily chart is in Breakout Mode. It is waiting for information from Brexit. Once the future is clear, there will be a trend up or down. A reasonable goal is a 300 – 400 pip measured move based on the height of the 4 month range.
The breakout can be up or down. Finally, there is a 50% chance that the 1st breakout will reverse and there would then be an opposite breakout.
Overnight EURUSD Forex trading
The 3 week rally has had 3 legs up. It is therefore a wedge bull channel. A wedge bull channel typically breaks to the downside and sells off for a couple legs. The swing down will probably begin this week.
There is a 40% chance of a bull breakout above a wedge bear flag. That then usually leads to a couple legs up. A measured move up from here is at the top of the 4 month range.
The 5 minute chart has been in a 30 pip range overnight after yesterday’s bull breakout. The odds are that the daily chart will start to turn down within a few days. Consequently, day traders will continue to scalp, but look for a downside breakout. Once they see it, they will swing trade. In addition, they will be more willing to sell rallies than buy dips for a week or two.
Less likely, the bulls will get the upside breakout. If so, day traders will be more eager to buy dips than sell rallies.
Summary of today’s S&P Emini futures price action and what to expect tomorrow

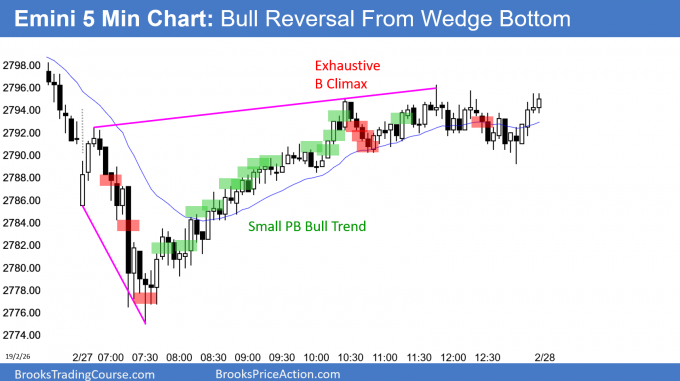
Here are several reasonable stop entry setups for today. I show each buy entry with a green rectangle and each sell entry with a red rectangle. I rarely also show limit order entries and entries on the close of bars. My goal with these charts is to present an Always In perspective. If a trader was trying to be Always In or nearly Always In a position all day, and he was not currently in the market, these entries would be logical times for him to enter.
End of day summary
The Emini sold off in a sell climax on the open. It reversed up from a wedge bottom. However, it stalled near the 60 minute EMA and last week’s high. The open of the week is an important magnet above. Therefore, the Emini will probably test it tomorrow or Friday.
Today was the 2nd day in a pullback on the daily chart. It is therefore a buy signal bar for tomorrow for a High 1 bull flag. But, the weekly buy climax is extreme and Monday was a strong sell signal bar. There will probably be sellers around Monday’s high.
Tomorrow is the last day of February. No matter what tomorrow does, February will probably be a bull bar closing near its high on the monthly chart.
See the weekly update for a discussion of the price action on the weekly chart and for what to expect going into next week.
Trading Room
Traders can see the end of the day bar-by-bar price action report by signing up for free at BrooksPriceAction.com. I talk about the detailed S&P Emini futures price action real-time throughout the day in the BrooksPriceAction.com trading room. We offer a 2 day free trial.
Charts use Pacific Standard Time
When I mention time, it is USA Pacific Standard Time (the Emini day session opens at 6:30 am PST, and closes at 1:15 pm PST). You can read background information on the intraday market reports on the Intraday Market Update page.
Hi Al or moderator,
When swing trading on a day like today, are you swinging your full position or are taking off some at a certain target and leaving the rest on to see how far it can get? If you are taking some off at a first target what is it usually based off of? Thanks
For example, is this a good idea?:
Let’s say with 100 shares, I set it up so I take 75 shares off at 1:1 and leave 25 shares on to see how far it can get. Basically taking off 3/4 of my position off and leaving a small piece on. Is that fine or is the ratio off?
I discuss this in the course. In general, when there is a swing signal, but the Emini is in a range, I plan to take about half off at 2 points. If the move looks like a leg in the range, I take all off. I rarely leave the entire position on at 2 points if the move is in a range because the probability of a swing is usually less than 40%.
Thanks!
Al: I bought above 28, stop below 18, for a swing. My premise was a possible SPB bull trend with the MA as support, so I intended to swing always in, trailing my stop, as long as the MA remained support. I knew there were likely buyers below, the risk was not big for my account, and I was willing to scale in if necessary.
But then at bar 31 I heard you say you would get out below below 30, so I chickened out and scratched break even. I did not get back in because, even though my premise remained correct, the bars did not look good.
I am not complaining. You have helped me immensely, but what is your advise? Should I stick with my premise and try to remain more convicted, or should I have gotten out and looked to buy again? Thanks for all your help.
While the channel was tight, 30 closed near its low and it was the 3rd push in a parabolic wedge after a wedge bear flag. I would pretty much always get out there. If I am trading Always In, I try to get back in above a bull bar closing near its high. A trader could also get long again above 44, but at that point, and exhaustive buy climax was likely. Trading after 32 was not likely to continue good because of the lack of big bull bars in the trend. A trading range was likely. The Emini began trading range price action with the dojis at 32 and 33, and clearly was in a range after 10:30.
I never worry about getting out of a trade and seeing the trend continue. As long as I do something reasonable, it is fine if in hindsight there was a better choice. The trading after 30 was difficult. After 51, it was mostly limit order entries
As I mentioned in the chat room, it was a Small Pullback Bull Trend, but it lacked surges and gaps. That made it likely to evolve into a trading range, which it did.
Getting out below 30 made sense because that was a parabolic wedge after a wedge bear flag. The lack of energy made the rally unlikely to get far above the earlier high. The Emini was in a tight range with limit order trading over the final 30 bars.
I never worry about doing what is best. My interest is in doing something that is reasonable. I never care if in hindsight there was a better choice.
Had I been willing to continue Always In Trading, I would have bought again above a bull bar closing near its high, like 31, 32, or 33.