Emini weak sell signal testing October sell climax low
I will update again at the end of the day.
Pre-Open market analysis
By falling below Friday’s low, the Emini triggered a sell signal on the daily chart. But, Thursday and Friday were big bull days. Therefore, Friday is a low probability sell signal bar. Consequently, a continuation of the 5 day tight trading range is more likely than a bear trend. However, if today is also a big bear day closing far below last week’s low, the odds will shift in favor of a test of the October low.
Overnight Emini Globex trading
The Emini is down 33 points in the Globex session. It will therefore have a big gap down. But, when there is a big gap down, there is an 80% chance of at least one reversal in the 1st 90 minutes. The bears do not want to sell far below the average price (the EMA). In addition, many bulls will see the selling as overdone. They will be willing to buy for scalps.
Typically, the bulls will look to buy either a wedge or double bottom for a possible early low of the day. Also, the bears will look to sell a wedge or double top near the EMA for a possible early high of the day.
There is only a 20% chance of a trend from the open up or down after a big gap opening. When the big gap is down, like today, if there is going to be a trend day, down is more likely.
Yesterday’s setups
Here are several reasonable stop entry setups from yesterday. I show each buy entry with a green rectangle and each sell entry with a red rectangle. I rarely also show limit order entries and entries on the close of bars. My goal with these charts is to present an Always In perspective. If a trader was trying to be Always In or nearly Always In a position all day, and he was not currently in the market, these entries would be logical times for him to enter.
EURUSD daily Forex chart beginning 1 – 3 day pullback after buy climax
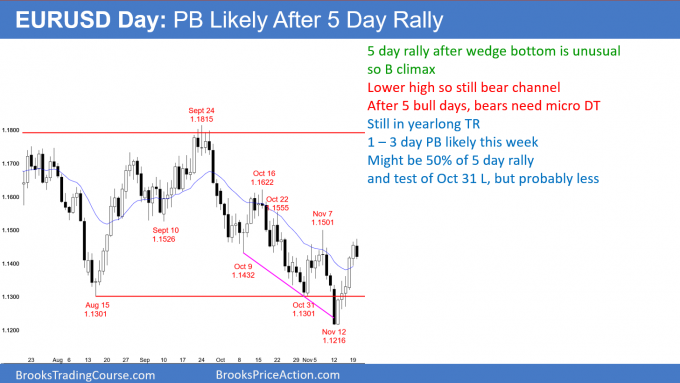
The EURUSD daily Forex chart has a bear trend bar and a lower high so far today. This is after 5 consecutive bull trend bars, which is a buy climax.
The EURUSD daily Forex chart rallied strongly for 5 days. Since every trend up or down over the past 6 month pulled back by the 5th or 6th day, this week was likely to have a pullback. Today might be the start.
Since 5 bull days represents strong buying, the bulls will be eager to buy again. That means the pullback will probably last only 2 – 3 days. However, it might last a little longer and reach the October 31 low.
The bears have another lower high in the bear channel that began on October 16. But, after 5 bull days, they will probably need a micro double top before they can test down to the November 12 low. Consequently, they will take profits between 100 – 150 pips down from today’s high.
I said over the weekend that last week was a buy signal bar on the weekly chart, but with problems. The 8 week tight bear channel made a big rally this week unlikely. Also, because last week’s range was big, many bulls did not want to buy above its high. The risk would be too big. Instead, they would look to buy a 50% pullback. That is currently around 1.1350.
Overnight EURUSD Forex trading
The EURUSD 5 minute Forex chart reversed down 60 pips so far overnight. This is probably the start of a 1 – 3 day pullback to around 1.1350. Consequently, the bears will sell rallies. Since the chart has been in a 30 pip tight range for the past 5 hours, the bears are mostly scalping. But, some will hold for around a 100 – 150 pip pullback over the next 2 – 3 days.
In addition, after a 5 day rally, the bulls will buy reversals up. However, since the bulls are exhausted, they will only scalp for the next couple of days.
Summary of today’s S&P Emini futures price action and what to expect tomorrow
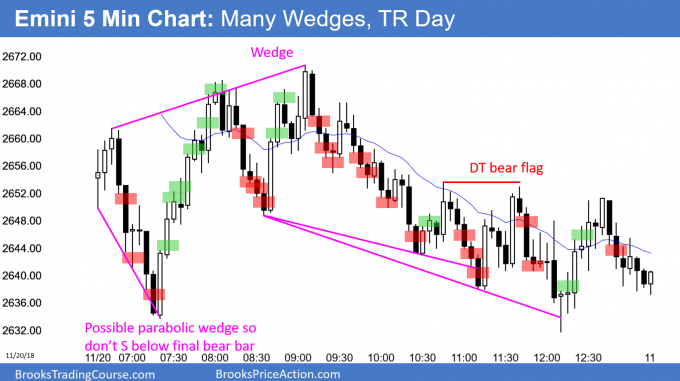
Here are several reasonable stop entry setups for today. I show each buy entry with a green rectangle and each sell entry with a red rectangle. I rarely also show limit order entries and entries on the close of bars. My goal with these charts is to present an Always In perspective. If a trader was trying to be Always In or nearly Always In a position all day, and he was not currently in the market, these entries would be logical times for him to enter.
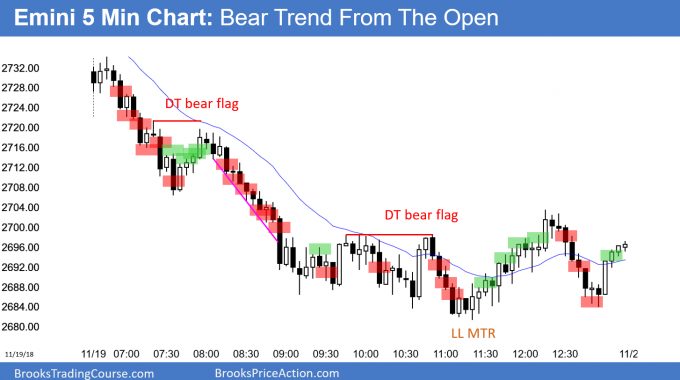
The Emini had a big gap down today. After a rally from a parabolic wedge bottom, it sold off from a wedge top. It then remained in a trading range, but closed below and near the open.
A gap up within the next few days would create an island bottom. That is a minor reversal pattern. In general, a big gap is exhaustive and the market usually has to go sideways for a few days. That is what is likely here. This is especially true since tomorrow and Friday will have less trading because of Thanksgiving.
See the weekly update for a discussion of the price action on the weekly candlestick chart and for what to expect going into next week.
Trading Room
Traders can see the end of the day bar-by-bar price action report by signing up for free at BrooksPriceAction.com. I talk about the detailed S&P Emini futures price action real-time throughout the day in the BrooksPriceAction.com trading room. We offer a 2 day free trial.
Charts use Pacific Standard Time
When I mention time, it is USA Pacific Standard Time (the Emini day session opens at 6:30 am PST, and closes at 1:15 pm PST). You can read background information on the intraday market reports on the Intraday Market Update page.


Al, on your chart you marked 38 as a sell. Why or why not would 37 been good enough? I was looking at it as a DT (19 & 32) pb short (37). Is 37 too weak of a signal bar after 36? Thx
37 was okay as well since there were 4 bear bars. But, it had a tiny body and followed a big bull bar. Therefore, there might have been buyers below. The probability is higher if there are 2 bear bars, and it is higher when selling below a bear bar with a bigger bear body.
Hi Al, why would you consider 9 High a magnet (instead of 9 Low) on the way down? Appreciate your insight.
Thanks.
Some bears sold the 9 close, expecting a further bear breakout. Others the 9 high, thinking it was a bad buy. Many scaled in higher, expecting the market to come back to their 1st sell and either continue down or enter a trading range. Since both were reasonable sell entries, both are magnets.
Al — on the daily and 60 min charts, a Leg 1 = Leg 2 projection puts ES right at the late October range low around 2602-2604. (Leg 1 being from the 2820 high a few days ago to the 2670 low on 11/15, and Leg 2 starting around the 2750 high Friday). It is almost as if the algorithms are betting on the range low being tested and they just mapped out a two-legged way to get there. It is classic big up and big down to the T. Is this a fair observation? And does that increase the odds that the low around 2600 will indeed be tested, possibly in the next 1-3 days? Particularly with the big gap down this morning.
Anything increases odds because there will be computers trading it. The market is confused and that means no one has a strong conviction. It typically has to fall further or rally further than what people think is reasonable before reversing. It certainly looks like it will test that level, especially since the October 29 low is 2903, and an obvious magnet.
Great, thanks Al. I noticed also that ES today at the lows around 2632 bounced almost exactly off a broad bull channel trendline on the daily globex chart drawn from the February low through the April higher low. Would be interesting to see if today’s double bottom holds because of that (which could mean the market won’t get to 2603). Thanks so much for all your guidance on the benefits of drawing trendlines and doing measured move projections.