Emini weekly buy signal bar on New Year’s Eve
I will update again at the end of the day.
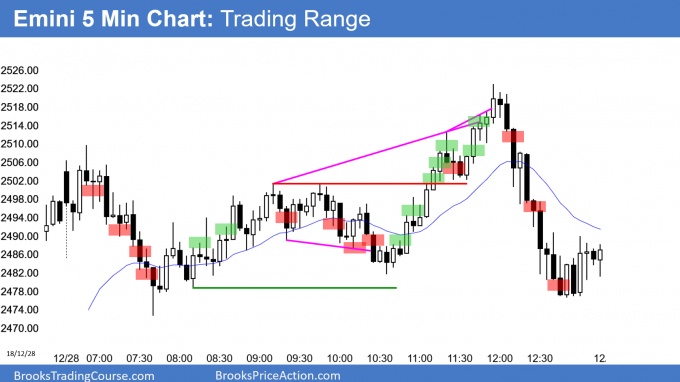
Friday was a bear bar on the daily chart after a 2 day pullback from a sell climax. It is therefore a sell signal bar in the bear rally. However, the 2 day rally was very strong. The odds favor at least 2 legs up. Consequently, there will probably be buyers not too far below Friday’s low.
The Emini will likely test last Monday’s high this week or next. It was a bear bar and therefore a bad buy signal bar. It was reasonable for bears to sell its high and scale in higher. Reasonable trades usually allow traders to avoid a loss. The Emini typically tests the entry price.
Today is New Year’s Eve. The Emini often spends a lot of time in tight trading ranges on this day. However, even if it does, the computers are still there. Look at the final hour of 2009 to see an example of a quiet New Year’s Eve that had a huge bear breakout in the final 30 minutes.
Weekly buy signal
Last week was a buy signal bar on the weekly Emini chart. The bulls are hoping that the breakout below the yearlong trading range will fail. However, that bear breakout from 2 weeks ago was big. That increases the chance of a 2nd leg down.
But, if the bulls can get a big bull bar this week, they will have erased the bear breakout. Even that is not enough to conclude that the bull trend has resumed. The 3 week selloff was extremely strong. The bulls therefore need to reverse most or all of it to make the weekly chart neutral again. Until then, the odds are that there will be at least a test of last week’s low within a month or two.
Because last week is a reasonable buy signal bar, this week will probably trigger the buy signal. That means that this week will likely trade above last week’s high. What traders will find out this week is whether there are more buyers or sellers above last week’s high. Traders have to be ready for a big move up or down.
Conflicting signals usually means confusion and a trading range
With the daily sell signal and the weekly buy signal, traders will be confused. Both signals will probably trigger, but fail to go far. The odds favor a trading range for at least a few weeks.
Pre-Open market analysis
Overnight Emini Globex trading
The Emini is up 19 points in the Globex session. New Year’s Eve is often very quiet. There is an increased chance of a tight trading range for most of the day.
Remember, Friday was a trading range day. The recent big days have been exhausting both the bulls and the bears. They will get worn out and more resistant to trading.
Furthermore, all of the computers will have switched to high volatility algorithms. This will reduce the number of computers willing to take the other side. Consequently, the high volatility programs will work less well and computers will start using other types of programs. This will result in less volatility.
But, even extremely quiet days can have big swings. This is especially true in the final 30 – 60 minutes. Therefore, day traders might get a quick, big profit in the final hour if they are ready to trade a strong breakout up or down.
Friday’s setups
Here are several reasonable stop entry setups from Friday. I show each buy entry with a green rectangle and each sell entry with a red rectangle. I rarely also show limit order entries and entries on the close of bars. My goal with these charts is to present an Always In perspective. If a trader was trying to be Always In or nearly Always In a position all day, and he was not currently in the market, these entries would be logical times for him to enter.
EURUSD Forex chart will breakout soon
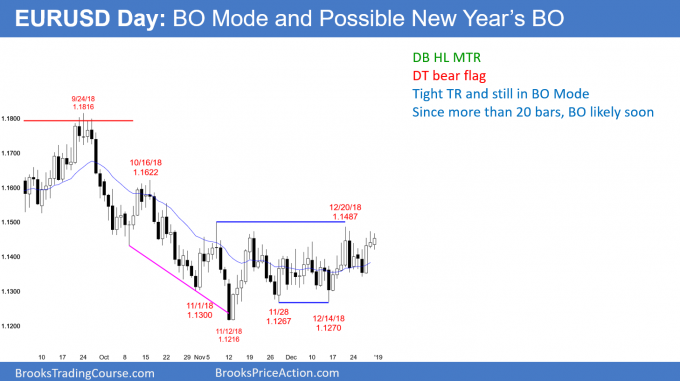
The EURUSD daily Forex chart has been in a tight trading range for 2 months. It will probably break out within a couple weeks.
The EURUSD daily Forex chart has been sideways in a tight range for 2 months. However, the bears have not had 3 consecutive bear bars. The bulls however currently have 3 consecutive bull bars and the had 4 two weeks ago. This is a slight advantage for the bulls.
But, it is not enough reason to be holding a swing trade, expecting a bull breakout. It is a sign of buying pressure. It therefore makes a bull breakout slightly more likely than a bear breakout.
However, until there is a breakout, there is no breakout. It is better to continue to bet on reversals until there is a strong breakout up or down. That means that traders are looking for reversals.
Since Forex markets often begin trends at the 1st of the year, there is an increased chance of a breakout within the next couple of weeks. In addition, the current tight range has lasted about 2 months. Over the past 3 years, breakouts typically came after around 2 months. Traders need to be ready to change from reversal trading to trend trading once the breakout begins.
Overnight EURUSD Forex trading
The EURUSD 5 minute Forex chart has been in a 45 pip range overnight. Most of the bars have been small, had prominent tails, and overlapped several prior bars. This is quiet, trading range trading. Day traders have been are looking for 10 pip scalps. Because of the worldwide holiday, this quiet trading is likely to continue all day.
Summary of today’s S&P Emini futures price action and what to expect tomorrow
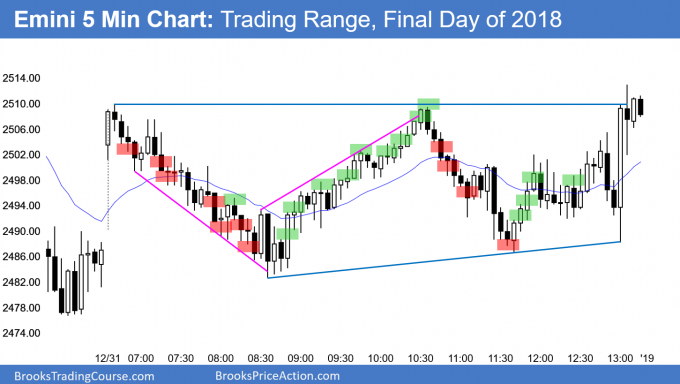
Here are several reasonable stop entry setups for today. I show each buy entry with a green rectangle and each sell entry with a red rectangle. I rarely also show limit order entries and entries on the close of bars. My goal with these charts is to present an Always In perspective. If a trader was trying to be Always In or nearly Always In a position all day, and he was not currently in the market, these entries would be logical times for him to enter.
Today was the last day of the month and year. The bulls got a close above 2,500. But, both the month and the year closed below their midpoints.
On the daily chart, today was a small inside day after a climactic reversal up. The rest of the week is still a holiday week around the world. Therefore, Wednesday has an increased chance of being another trading range day.
The daily chart is probably going to form a trading range for the next month. Consequently, traders will buy selloffs, sell rallies, and take quick profits.
The sell signal on the daily chart and the buy signal on the weekly chart will probably both trigger within a week. But, since a trading range is likely, the breakouts will be minor. The breakouts will probably reverse within a few bars for the next month.
See the weekly update for a discussion of the price action on the weekly candlestick chart and for what to expect going into next week.
Trading Room
Traders can see the end of the day bar-by-bar price action report by signing up for free at BrooksPriceAction.com. I talk about the detailed S&P Emini futures price action real-time throughout the day in the BrooksPriceAction.com trading room. We offer a 2 day free trial.
Charts use Pacific Standard Time
When I mention time, it is USA Pacific Standard Time (the Emini day session opens at 6:30 am PST, and closes at 1:15 pm PST). You can read background information on the intraday market reports on the Intraday Market Update page.


Hi, Al,
was wondering if your stop order was triggered above b19 (also as you’ve shown on your trades), would you cut loss immediately or would you rather wait to see if Friday’s L will hold?
Thank you,
In general, I get out as soon as I think the market is not doing what I thought was likely. However, when a reversal is likely, I am more willing to hold to a losing position, use a wide stop, and look to add on when there is another reasonable setup.
If I am long and a sell signal triggers, I usually exit my long trade. Most of the time, I do not reverse. I typically need a couple of bars before I feel that I am once again objective. If my entry was clearly a quick trap, I am more willing to reverse. This is more common when I am trading with the trend and there is then a strong reversal at a time when the context is good for a reversal. I am less likely to reverse my position when I am against a trend, expecting a reversal, but then the trend resumes. Once a trend begins to create reversal setups, it will usually soon reverse. This sometimes takes 1 – 2 attempts.
Thank you very much for this insight.
Al,
Happy new year and wish you the best. Always learn more when I read your daily reports.
Just a quick question. Can an option trader scalp on a trading range like today? What should be the minimum scalp size goal for an option trader who trades based on 5 min chart? Many option traders suggest that the entry should be with limit order but I know you suggest that most entries should be based on stop orders. I’ve also observed that my orders does not get filled many times when I want to enter with limit order. Many traders have suggested me to increase my time frame to 10 min chart and stick to my trade for 30 min or so. When I trade in paper money platform I don’t have this problem and my orders gets filled very soon since my orders gets filled between bid and ask. But when I trade live that’s a different story. Many times on trading range days I lost money but on trend days most of the days I was the winner. Could you please guide me what needs to be done?
I hope you have a wonderful day and that the year ahead is filled with much love, many wonderful surprises and gives you lasting memories.
I sometimes day trade options, but only when the range is exceptional. I would never daytrade options for a 10 cent scalp because getting reliable fills at the time and price I want is too rare. When I do daytrade, I am expecting at least 50 cents – $1 profit.
Most of the time, when I am trading SPY options, I enter and exit at the market. This is because I am usually eager to get filled. Also, since I am looking for at least a 50 cent to a $1 profit, the bid-ask spread is relatively small. Constantly watching for a fill and adjusting limit orders would be a distraction. I need to focus on the Emini.
In general, it is easier for most traders to make money during trends. There are too many variables during trading range days. Traders need to make too many decisions, which increases their error rate.
As for paper trading, you discovered one of the many problems… fictitious fills. Fills that you cannot regularly get when trading real money. The result is that the performance on paper is always better than in reality.