Profit taking around Amazon and Alphabet Google 1,000 Big Round Number
Updated 6:47 a.m.
The Emini had many small dojis in a tight range for the final 3 hours yesterday. Today began with a doji and a tight trading range near the low of yesterday’s range.
Because yesterday had a bull breakout above a 3 day channel, the odds are that today will test the bottom of the channel. There are 2 ways to draw it. The distant one is around yesterday’s low, which is around last week’s high and the 60 minute moving average. Since these are all magnets below, there is a slightly higher chance of a selloff to those levels at some point today.
Yet, this is a quiet open. Therefore there is no momentum up or down. Consequently, the bulls and bears are balanced. So far, today is continuing yesterday’s trading range trading. Unless there is a strong breakout up or down, the odds favor another small trading range day.
Pre-Open market analysis
The Emini gapped to a new all-time high and above its 2 month trading range. Hence, the bulls want a measured move up to the 2500 Big Round Number.
Furthermore, both GOOGL and AMZN tested the 1,000 Big Round Number. Since their test is climactic, it is a buy vacuum test of resistance. Consequently, the odds favor a pullback and a trading range soon. The 1st target for the bears is yesterday’s low because yesterday was a buy climax for both stocks.
This would probably correspond to a trading range in the Emini. Because of the extreme buy climax on the weekly chart, it is still more likely that the Emini will fall about 100 points to the bottom of the 2 month range than rally 100 points for a measured move up to 2500. Yet, if the bulls get strong follow-through buying over the next several days, the odds will become 50-50. A rally to above 2430 or so would make it more likely that the Emini will continue up to 2500 without much of a pullback.
Overnight Emini Globex trading
The Emini is down 3 points in the Globex session. Since it has rallied for 6 consecutive days, the bulls are probably exhausted. Furthermore, the rally was a bull breakout above a 3 day tight bull channel. This is a buy climax. It therefore will probably limit the upside today. Therefore, the Emini will probably pull back into a trading range over the next couple of days.
Weekly and Monthly charts
The Emini is near the end of the month. May is the entry bar for a breakout above a one month High 1 bull flag. While the monthly bar is small, it is at its high. Because the High 1 bull flag is weak, the entry bar has an increased chance of having a tail on its top. That means that the Emini has an increased chance of pulling back a little in the final 3 trading days of the month.
Today is Friday and therefore weekly support and resistance is important, especially in the final hour. The most important price is last week’s high of 2404.50. If the Emini is within about 5 points, it could quickly get pulled there. If so, it might oscillate around it at the end of the day.
EURUSD Forex market trading strategies
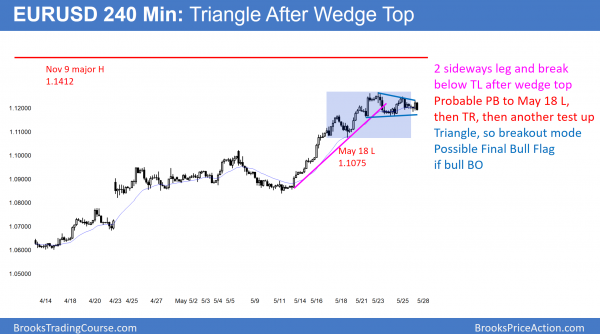
After a wedge top, the 240 minute EURUSD chart went sideways for 2 legs. It is now in a triangle and therefore in Breakout Mode.
After rallying strongly for 2 weeks, the EURUSD 240 minute chart is now in a triangle. Because a triangle is a trading range, there are both reasonable buy and sell setups. Furthermore, the probability of a breakout and measured move is the same for the bulls and bears. The bears see a lower high major trend reversal. The bulls see a bull flag. If the bulls get their breakout, the triangle will probably be the Final Bull Flag. Hence, the breakout will probably reverse back down into the triangle, even if it 1st goes above the November 9 major top.
A bear breakout would probably simply test May 18 low and then form a trading range for a couple of weeks. This is because the momentum up over the past month has been strong. Hence, the odds still favor a test of the November 9 high whether or not the market pulls back 150 pips 1st.
Overnight EURUSD Forex trading
The EURUSD Forex market has been in a trading range for 5 days. In addition, the overnight range has been about 50 pips. This is therefore big enough for day traders to scalp for 10 – 20 pips.
Since there are both valid buy and sell setups, swing traders could either be holding long or short. However, it is usually better to wait for more information before swing trading again. Consequently, many are waiting for either a strong breakout up or down, or a reversal after a breakout and a measured move up or down.
Summary of today’s S&P Emini futures price action and what to expect tomorrow
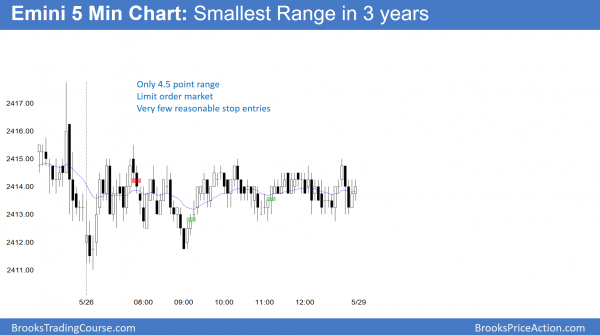
The Emini had its smallest range in 3 years. It was mostly limit order scalping for aggressive trades. Most should not trade.
While it is a buy signal bar for Tuesday, it is a buy climax. Therefore a bull breakout will probably only extend for a day or two before pulling back.
See the weekly update for a discussion of the price action on the weekly candlestick chart and for what to expect going into next week.
Traders can see the end of the day bar-by-bar price action report by signing up for free at BrooksPriceAction.com. I talk about the detailed S&P Emini futures price action real-time throughout the day in the BrooksPriceAction.com trading room. We offer a 2 day free trial.
When I mention time, it is USA Pacific Standard Time (the Emini day session opens at 6:30 am PST, and closes at 1:15 pm PST). You can read background information on the intraday market reports on the Intraday Market Update page.

