September 2016 stock market correction
Updated 6:56 a.m.
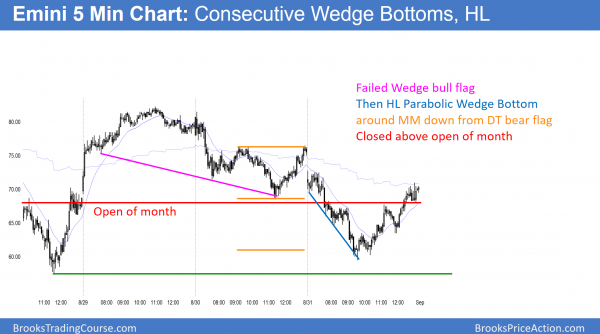
The Emini opened with a tight trading range just above yesterday’s low and the open of the month. This is a breakout mode setup. Because the Emini was unable to reverse strongly above the open of the month yesterday and did not reach the open of the month, many traders believe it was not adequately tested. Hence, the odds are that the Emini will touch it during the 1st hour or two.
Yet, because of 2 months of tight trading range trading and most days being trading range days, the odds are that the Emini will not react strongly to the test. With the quiet open near support, the odds are that today will be another trading range day. Unless there is a strong breakout up or down, the Emini will probably not get too far from the open of the month. Furthermore, it probably will not decided to close above or below it until the final bar of the day.
While today can be a strong trend day, the odds are less because of the quiet open.
Pre-Open Market Analysis
Monday was an ioi Breakout Mode setup on the daily chart. Yesterday triggered the short when it traded below Monday’s low. Yet, the Emini is at the bottom of a tight trading range. Therefore, stop entries are likely to be losers. This means that yesterday’s bear breakout probably will not fall far.
Because the Emini is in a tight trading range on the daily chart, it is in Breakout Mode. It will soon breakout. There is a 50% chance that the breakout will reverse. In general, there is also a 50% chance that the breakout will be up and a 50% chance it will be down. However, because of the buy climax on all time frames, the odds of a big rally are 40%. Therefore a “successful” bull breakout could rally to the 2200 – 2220 resistance area, and then reverse down. There is a 60% chance of a 50 – 100 point correction before the Emini gets above the 2220 measured move target (see my weekend blog).
Monthly buy climax
Today is the last trading day of the month. Hence, monthly support and resistance are important. If today closes above the 2168.00 open of the month, the candlestick pattern on the monthly chart will be a bull trend bar. Furthermore, it would be the 7th consecutive bull trend bar. That rarely happens on the monthly chart. Therefore the odds are that tomorrow will close below the open of the month.
If instead it closes above the open of the month, it will make August the 7th consecutive bull trend bar. Look back at the monthly chart over the past several years. You will see how unusual that is. You will also see that most of the time when the monthly chart has 6 or 7 consecutive bull trend bars, it then has about a 100 point correction. Hence, the Emini is probably going to have a 100 point selloff during September or October.
Yet, the bullish momentum on the monthly chart is strong. Therefore bulls will buy the pullback. Hence the reversal down will be minor on the monthly chart. Yet, a 100 point selloff could create a brief bear trend on the daily chart.
Emini Globex session
The Emini continues to lack energy. Traders therefore believe that the current price is about right. It traded in a tight trading range overnight, and that range will probably at least double today. Because the Emini has been unable to move far from the open of the month, and the monthly chart is so unusual, the market is telling traders that the open of the month is very important. Hence, it might be a magnet right up to today’s close. If the Emini is within about 5 points of the open after 11 a.m. today, the odds are that it will test the open before the close.
Forex: Best trading strategies
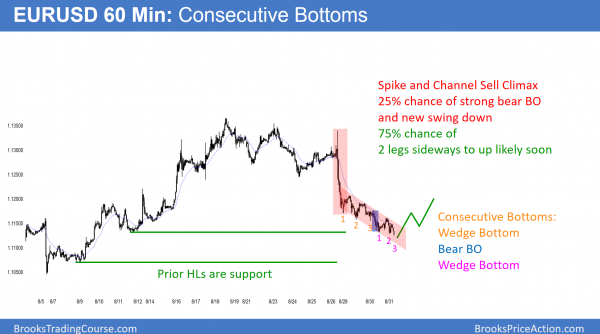
The 60 minute EURUSD chart is in a bear channel after a strong bear breakout (spike). A Spike and Channel bear trend is a sell climax.
As a result of the Spike and Channel bear trend, there is a 75% chance of a bull breakout above the channel and then about 10 bars and 2 legs sideways to up. Because of the consecutive bottom attempts, and the 2nd bottom already having 3 pushes down and therefore possibly near completion, the bottom will probably form today.
I wrote yesterday that the wedge bottom was in too tight of a channel to be a reliable bottom. Also, there were measured move targets below. The EURUSD then continued lower yesterday. However, the selloff lacked consecutive big bear bars closing on their low. Therefore the selloff was more likely a bear leg in a developing trading range than the middle of a strong bear trend. The odds favor a 1 – 2 day sideways to up move.
Friday’s unemployment report and the Fed rate hike
The Fed will probably raise interest rates in September or December. If Friday’s unemployment report is very strong, the Fed might raise rates in September. This will affect all financial markets. While pundits have strong opinions about whether it will be bullish for the dollar, the truth is that no one knows. Traders will wait to see if the market has already priced it in. Furthermore, it might have priced it in too much. Therefore, financial markets might do the opposite of what appears logical. Traders need to simply watch the charts to see if most of the money is buying or selling. Then, just do what the market is doing, even in some very impressive guy on TV says the opposite.
Summary of today’s S&P Emini futures price action and what to expect tomorrow
While the Emini sold off early, it rallied back to above the open of the month by the end of the day.
The open of the month has been the most important price for the past week, and it was a magnet today. This is therefore the 7 consecutive bull trend bar on the monthly chart, which is rare. Hence, there is a 70% chance that September will be a bear bar. Therefore, September will probably close below tomorrow’s open.
Because August was a doji bar on the monthly chart, it was weak follow-through buying after the July breakout above the 2 year trading range. This means that the chances that the breakout will reverse down are now higher. Yet the 7 months of buying make it likely that bulls will buy the selloff for a test back up to the high. As a result, any big selloff on the daily chart would be just a bull flag on the daily chart.
See the weekly update for a discussion of the price action on the weekly candlestick chart and for what to expect going into next week.
Traders can see the end of the day bar-by-bar price action report by signing up for free at BrooksPriceAction.com. I talk about the detailed S&P Emini futures price action real-time throughout the day in the BrooksPriceAction.com trading room. We offer a 2 day free trial.
When I mention time, it is USA Pacific Standard Time (the Emini day session opens at 6:30 am PST, and closes at 1:15 pm PST). You can read background information on the intraday market reports on the Intraday Market Update page.


Al, in Crude, do you think the last two days’ big bear trend bars are enough to put the market AIS for most traders and we will get 2 legs sideways to down and a test of $40-ish? Thanks!
The momentum down is strong enough for at least a small 2nd leg down. However, that 2nd leg down might be simply one bar. It is AIS on the daily chart, but this selling is so extreme that it may pause soon. 40 is the neck line of the Head and Shoulders bear flag and therefore an important magnet. The odds are it will get there.
Hi Al,
When in channels (e.g. EU hourly chart you shared) then what type of reversal is more common, failed breakout attempt below channel or micro double bottom?
Many Thanks
Most reversals need a double bottom, and often a micro DB is all that bulls need. The stronger the bottom, the earlier bulls will enter. If a bottom is not clear, many will wait to buy until after a strong bull breakout.