Emini and Forex Trading Update:
Tuesday January 14, 2020
I will update again at the end of the day.
Pre-Open market analysis
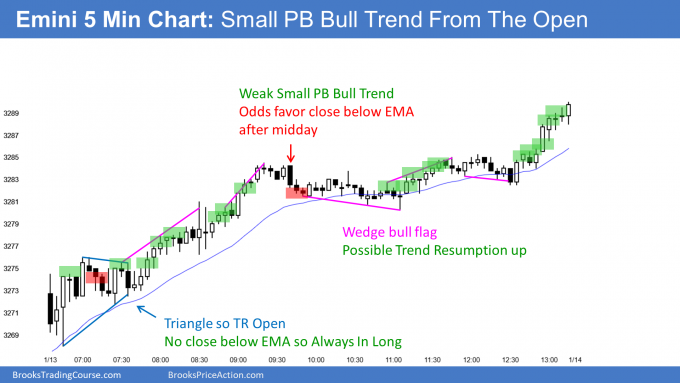
The Emini rallied from the open yesterday in a Small Pullback Bull Trend. After breaking to a new all-time high, there was some profit-taking and the rallied stalled. There was trend resumption up at the end of the day. This increases the chance of a gap up today.
Everyone knows that the daily chart is overbought. However, traders are still buying every 1 – 3 day pullback. They will continue to do that until there is a clear top or a strong reversal down.
Overnight Emini Globex trading
The Emini is down 2 points in the Globex session. Since yesterday was a strong bull trend, the rally is unsustainable. It should attract some profit taking by the end of the 2nd hour. That typically results in at least a couple hours of sideways to down trading.
Yesterday’s 3 hour tight trading range is obvious support. That sideways trading means that traders thought it was a fair price. They might conclude that it still is a fair price. If so, today could get pulled back down there and go sideways again for an hour or more.
A tight trading range late in a bull trend is often the Final Bull Flag. It is a magnet and usually draws the market back to it. That is a reasonable downside target if there is a reversal today.
When there is a strong bull trend day, like yesterday, there is a 25% chance that it will continue all day today. Therefore, if today rallies on the open and there is no credible top, day traders will continue to buy.
More likely, any early rally will fail within a couple hours. Day traders will expect more trading range price action today and sideways to down trading for at least 2 hours at some point.
Yesterday’s setups

Here are several reasonable stop entry setups from yesterday. I show each buy entry with a green rectangle and each sell entry with a red rectangle. I rarely also show limit order entries and entries on the close of bars. Buyers of the Brooks Trading Course and Encyclopedia of Chart Patterns have access to a much more detailed explanation of the swing trades for each day.
My goal with these charts is to present an Always In perspective. If a trader was trying to be Always In or nearly Always In a position all day, and he was not currently in the market, these entries would be logical times for him to enter.
EURUSD Forex market trading strategies

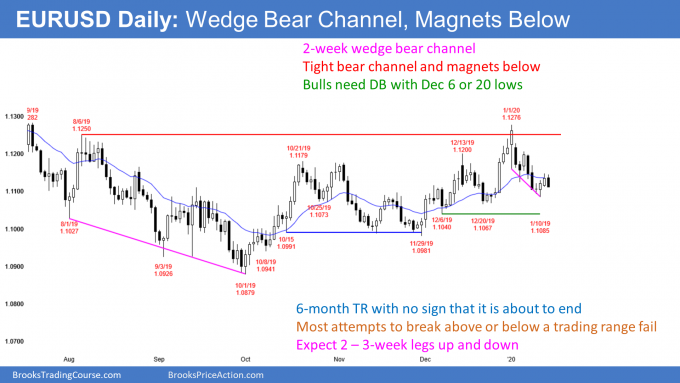
The daily chart of the EURUSD Forex market has been in a bear channel for 2 weeks. It has also been in a trading range for 6 months with most legs up and down lasting 2 – 3 weeks. There is currently no reason to expect this to change.
Most reversals come at support or resistance. The December 6 and December 20 lows are obvious support. Traders expect this selloff to continue down to that area over the next week. They will then watch for a sign of a reversal up or a continuation down to the next support at the November 29 low.
Overnight EURUSD Forex trading
The 5 minute chart of the EURUSD Forex market sold off 40 pips over the past 6 hours It is now below yesterday’s low. The bears see yesterday as a Low 1 sell signal bar on the daily chart in a 2 week bear channel.
But it has a bull body and it was the 2nd consecutive bull bar. This is a weak sell signal. Consequently, there might be more buyers than sellers below its low.
The overnight selloff has been in a tight bear channel. That means the bulls have not yet been buying. However, because yesterday was a weak sell signal, the odds are against today continuing much lower. Therefore, the bears will probably soon switch to selling 20 pip rallies from selling at the market.
Once the bulls start to see 20 pip bounces, they will begin to buy tests of the day’s low. That should result in a trading range forming today around yesterday’s low.
Can today reverse up strongly from below yesterday’s low? Unlikely. The bars on the 5 minute chart are small and there are magnets below on the daily chart.
What about a continued bear trend day? While it is possible, the weak sell signal on the daily chart will make traders want to sell rallies. That reduces the chances of a big bear trend day. The bear trend will probably evolve into a 20 – 30 pip tall trading range for the rest of the day, and close around yesterday’s low.
Summary of today’s S&P Emini futures price action and what to expect tomorrow

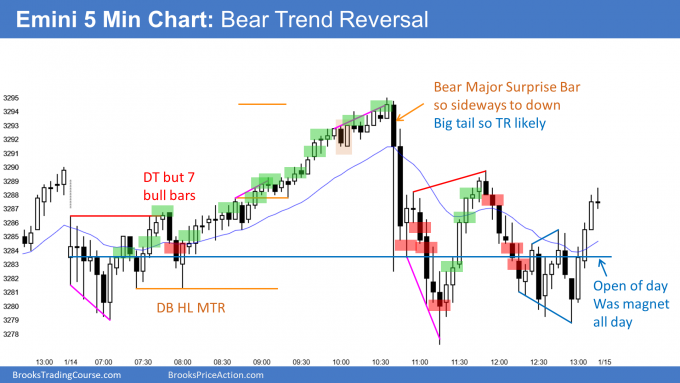
Here are several reasonable stop entry setups for today. I show each buy entry with a green rectangle and each sell entry with a red rectangle. I rarely also show limit order entries and entries on the close of bars. Buyers of the Brooks Trading Course and Encyclopedia of Chart Patterns have access to a much more detailed explanation of the swing trades for each day.
My goal with these charts is to present an Always In perspective. If a trader was trying to be Always In or nearly Always In a position all day, and he was not currently in the market, these entries would be logical times for him to enter.
End of day summary
After a trading range open, the bulls got a rally from a double bottom higher low. The rally continued up in a Small Pullback Bull Trend for a measured move. The Emini then collapsed on some China tariff news. After a new low, there was a strong reversal back up, and the Emini finished just above the open.
The one bar selloff from the high was a Bear Major Surprise Bar. It therefore could lead to additional sideways to down trading tomorrow. However, the bull trend on the daily chart has been very strong. Therefore, the odds still favor higher prices, even if there is a 1 – 3 day pullback.
See the weekly update for a discussion of the price action on the weekly chart and for what to expect going into next week.
Trading Room
Traders can see the end of the day bar-by-bar price action report by signing up for free at BrooksPriceAction.com. I talk about the detailed S&P Emini futures price action real-time throughout the day in the BrooksPriceAction.com trading room. We offer a 2 day free trial.
Charts use Pacific Standard Time
When I mention time, it is USA Pacific Standard Time (the Emini day session opens at 6:30 am PST, and closes at 1:15 pm PST). You can read background information on the intraday market reports on the Market Update page.
Al, I took the B18 long for a swing but exited in hindsight too early below B32. My thinking at the time was we were in a potential TR, no strong breakout above B18 range (bear scalpers making money at highs), potential resistance at 4pt move above 18 for longs and high of yesterday. B28-30 was a brkout but decreasing bull bodies and B33 set up a potential micro DT and 2nd entry. Since I was thinking we were at a possible TR high and possible trap with 2nd entry short, is it a good idea to exit there, or how should I weigh “what trumps what” with current price action. As you know, there are always reasons for bulls/bears to buy/sell on each bar…just wondering your thoughts during those bars. Thanks always
Correct me if I am wrong, but if you exited below bar 32 your sell order was triggered during PB of bar 34.
You just described many details of PA, which Al teaches, but did not managed to have correct stop, which was still needed to be below bar 27/28.
To accept initial risk is difficult, especially if you`ve had open profit since bar 18.
Reading your question, it sounds like your mind was looking for reason to get out.
And you found many of them.
If you cannot place correct SL, it means emotions are taking over your PA reading
This is clear sign of being out of zone and you need to bring back alignment between your technical reading and emotions .
Before improving your best, focus how to improve your worse.
Correct. Sell was during B34 (2nd entry short, potential DT testing yesterday’s close). Previous “short term” pa proved sellers were selling highs of 16, 23…and brkout 28-30 bars getting smaller. My main question is how to determine which patterns trump other potential patterns, during this trade…noting also beginning of day was a lot of trading range pa. In hindsight, I could have re-entered above 34, but there again I was hesitant due to the fact that it was a 4 bar ttr near yesterday’s close resistance. Market “could have” failed above sharply as it eventually did below 49. Though I do agree with you that obviously in hindsight at that moment I was wrong and out of zone. Just trying to better improve my reading.
I do apologie for this reply:), but I just would like to repeat how important I feel is what I wrote.
You need to manage your trading in a way you do not get out of zone. You can not resolve bad SL decision by gaining more informations. Anyway, that is not answering your question:). I am sure Al will.
No worries. I understand you’re communicating trading zone mentality and appreciate your response. Unfortunately, I’m still trying to grasp trade mgmt after entry, which I “believe” 🙂 is important. Walking away from computer after taking a trade is too difficult for me to do as I’m constantly seeing reasons to enter/exit trades. Working hard on focusing on Al’s best trade setups for beginners – but by god it’s difficult waiting, watching, studying the mkts all day!
Bull case:
a) bars 31-33 BO-PB unable to close gap from 28 – 30 bull spike=AIL
b) 30 -33 – 4 bars sw/TR=most BO of TR fails
c) bar 33/L2 was bull bar in bull channel after bull spike with open gap, possible MM, far above EMA.
Trade management after entry is important, but as I said you need to improve your worse before adding to your best 🙂