Trading the unemployment report breakout
Updated 6:54 a.m.
The bulls broke above yesterday’s high on the open and therefore triggered the buy signal on the daily chart. Yet, the first few bars were not strongly bullish. Furthermore, the rally has lasted about 120 bars without much of a pullback. Especially relevant is that the bears made money with limit orders all of the way up. This is more consistent with a bull leg in a trading range than a bull trend.
While there is a 25% chance that the bulls will get a strong breakout above the 2 day tight channel and then a measured move up, there is a 75% chance that the channel will convert into a trading range within the 1st 2 hours today. A trading range means that there will be a sideways to down move lasting at least a couple of hours. Because the bull channel was tight, the odds of a strong bear trend are only 40%. More likely, there will either be a trading range or a weak bear trend. There is only a 25% chance of a strong bull trend today.
Pre-Open Market Analysis
The Emini was in a bull channel yesterday. Yet, the range was only 4 points for most of the day. It therefore was mostly trading range price action. It traded between the 60 minute moving average above and the 2152 bottom of the 3 week trading range below.
This lack of movement is because the Emini is still deciding whether yesterday’s bear breakout will be successful. The bulls see a bull flag and want a rally to a new high. The bears want a 40 – 100 point correction. While both will probably achieve their goals over the next month or two, the market has not decided which will come first.
Friday’s unemployment report
The Emini might be waiting for Friday’s unemployment report. Many traders expect it to be a catalyst for a breakout up or down. While Tuesday’s breakout closed back in the 3 week range and yesterday was bad follow-through for the bears, the context favors the bears. The breakout was big, the Emini is overbought on the weekly chart, the breakout point at the top of the 2 year range probably needs a test, and August often has corrections.
Because yesterday was a bull inside bar after Tuesday’s bear breakout, it is a buy signal bar for today. Bulls see it as a sign that the bear trading range breakout failed. It is similar to the June 28 bull bar on the daily chart after the prior day’s strong bear breakout.
Yet, with Friday being an important catalyst, most traders will be hesitant to buy on a stop above yesterday’s high. Furthermore, they will be reluctant to sell on a stop below its low. It is a bull bar after a breakout bar that had a big tail. The odds are that there are buyers below. In conclusion, today will probably not be a strong trend day up or down.
Globex Emini session
The Emini rallied overnight and completed a clear 3rd leg up on the Globex chart. It then sold off over the past hour. Three push patterns often have one more push before having a couple of legs sideways to down. However, the odds are that the Emini will not rally much more before evolving into a trading range today.
While the day session also has 3 pushes up, that rally is in a tight bull channel. It is therefore unlikely to reverse into a bear trend without 1st going sideways for several hours. Because the channel is tight, the bulls see it as a resumption of the July rally.
Yet, it stalled yesterday at the 60 minute moving average and a 50% pullback. Furthermore, it is still below the top of Tuesday’s sell climax and mostly below the 3 week trading range. The bears know that they have at least a 50% chance of a 2nd leg down. Furthermore, because of the context on the daily and weekly charts, the pullback might be as much as 100 points.
Forex: Best trading strategies
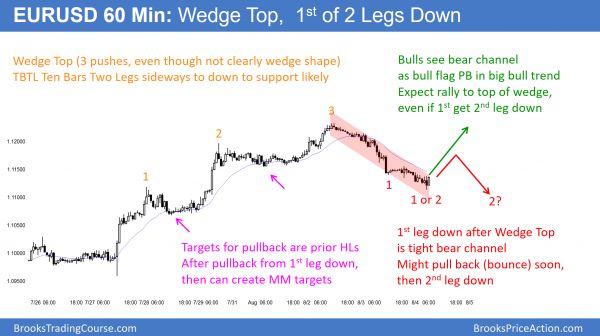
The selloff from the 60 minute EURUSD Forex chart continued for the 2nd day. The overnight leg had 3 pushes down and therefore formed a wedge channel. It reversed up strongly over the past hour. The bulls see the 2 day selloff as a bull flag. The bears see it as the 1st of 2 legs down from the wedge top.
The 60 minute EURUSD Forex chart turned down yesterday from a wedge top. A wedge bull channel is a buy climax. Hence, traders expect two legs down. Because the selloff was in a tight bear channel, it was one leg down. Traders therefore expect the first rally to be sold. They then expect another leg down as a minimum objective. While it is a pullback in a bull trend, the selloff was strong enough so that the chart will probably stay in a trading range for a couple of weeks.
Spike and Channel Top candlestick pattern
Typically when there is a deep pullback from a Spike and Channel rally, the channel evolves into a trading range. Especially relevant is the depth of the pullback. This creates a Big Up, Big Down candlestick pattern. As a result, traders lose confidence and are confused. They are less willing to hold onto positions, and therefore create a trading range. The target for the top of the range is the top of the wedge.
European Forex session
While the EURUSD reversed up over the past hour after 3 pushes down overnight, it still might probe further down for the bottom of this bear leg. Because the 2 day channel is tight, the odds are that it is only the 1st leg down. Therefore the odds are that traders will sell the 1st rally. Consequently, it will probably be a lower high followed by one more leg down. After there are two clear legs down, the bulls will have a better chance of testing the top of the wedge.
Unemployment report
Because all financial markets will try to become neutral before Friday’s unemployment report, the odds are that today will be a quiet day. If so, day traders will mostly scalp, primarily using limit orders. As always, if there is a strong breakout up or down, they will swing trade. As a result of the Big Up, Big Down of the past 2 days, traders are confused. When confused, they take quick profits. Hence, swings do not go far, and the market stays mostly sideways.
Summary of today’s S&P Emini futures price action and what to expect tomorrow
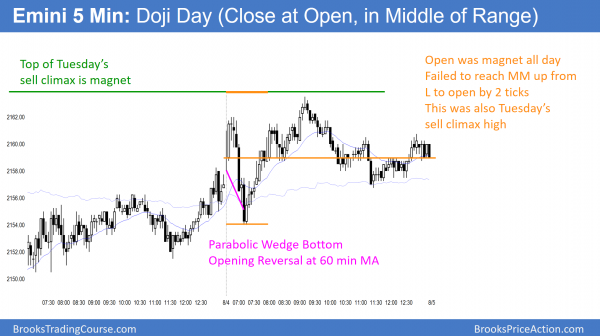
The Emini had an Opening Reversal up from the 60 minute moving average. It pulled back from the strong bear breakout to above the bear high. The pullback from the early selloff ended above the top of the selloff. Yet, it was unable to get above Tuesday’s sell climax high. It remained in a trading range and closed at the open.
Today was the entry bar for the bulls who bought above yesterday’s high. They saw yesterday as a failed breakout below the 3 week trading range. Yet, today was a weak bar for the bulls. Instead of a big bull bar closing on its high, it was a doji bar. Furthermore, it was unable to get above Tuesday’s sell climax high, despite coming to within 2 ticks. Hence, Tuesday’s bear breakout was disappointing for the bears. Today’s reversal up was disappointing for the bears. The Emini is neutral going into tomorrow unemployment report.
See the weekly update for a discussion of the price action on the weekly candlestick chart and for what to expect going into next week.
Traders can see the end of the day bar-by-bar price action report by signing up for free at BrooksPriceAction.com. I talk about the detailed S&P Emini futures price action real-time throughout the day in the BrooksPriceAction.com trading room. We offer a 2 day free trial.
When I mention time, it is USA Pacific Standard Time (the Emini day session opens at 6:30 am PST, and closes at 1:15 pm PST). You can read background information on the intraday market reports on the Intraday Market Update page.


Al, I have been focusing on trading breakouts/breakdowns (quick moves). Is it reasonable to construct a trading plan that focuses on catching the 1 or 2 breakouts/breakdowns that happen intraday. For example, today I sold the bear breakdown at 6:54am. However, I missed catching the bull breakout starting around 7:12am.
I like to go in with 2 lots, taking 1 off at +2pts and wait for +4pts on the next one. If I don’t get the move immediately I am quick to exit 1 lot for a small loss, and have my finger on the trigger to get rid of the other. My thinking is that I know what I’m looking for (a quick move), and if I don’t get that immediately then it means I probably read the market wrong. So I figure taking 1-2pts loss on each lot for my losers is okay as long as I’m making 2-4pts on each lot for my winners. Does this make sense?
It does make sense and many traders focus on catching an early breakout. Ti see if you are managing well, all you have to do is follow your account balance. If it is steadily increasing, then you have a good approach. If not, look back at your trades to see if you are doing what you say you want to do. Make sure that you are consistent.
I do a strategy like that as well. Its always hard to be patience for me