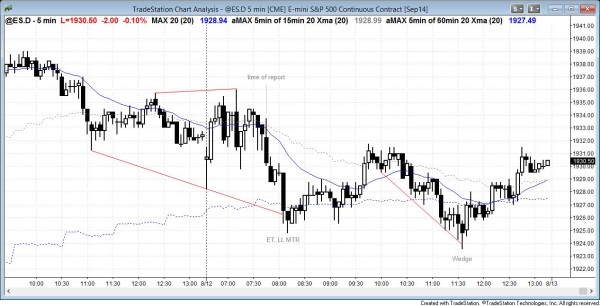
I posted this S&P500 Emini candle chart after the close. The Emini had a trending trading range day and closed near the open of the day, and therefore formed a doji candle on the daily chart. The second leg down was a channel and therefore the day was also a spike and channel bear trend. As expected, the rally from the low tested the top of the channel by the end of the day.
Time of update 7:41 a.m. PST.
The Emini is having a breakout mode trading range open. The Emini closed the gap below yesterday’s low and reversed up. This might be the start of a second leg up, even though the pullback from yesterday’s high does not appear to have enough bars compared to the size of the 5 day wedge bottom. There is usually more symmetry when the market forms the right side of the pattern (a higher low major trend reversal, which is a head and shoulders bottom). This means that the Emini might have to go sideways to down for another day or two.
The S&P500 Emini is in breakout mode for day traders. Day traders are waiting for a breakout up or down. Once it forms, they then will look for a pullback and a second leg. Since the opening range is big, the breakout might not go far enough to create a measured move based on the entire opening range. However, it could fall for a measured move based on the high of the day to the open of the day. If so, the open will be a magnet at the end of the day, and the day could become a large trading range day, forming a doji bar on the daily chart.
At the moment, this big trading range open will probably lead to a small trend day or a trading range day. If the breakout is big enough, however, the day could become a trend day.
Higher time frames
The Emini rallied for a day and a half up from a wedge bottom that lasted 5 days, and then it pulled back yesterday at the 20 bar exponential moving average on the daily chart. A wedge bottom trend reversal usually has a second leg sideways to up. The pullback might continue today. Whether it ends today or tomorrow, it probably will be followed by a second leg sideways to up. The bulls will see that reversal up as a higher low major trend reversal (the right shoulder of a head and shoulders bottom). The top of the first leg up, which was yesterday’s high, was just above last week’s high, which is a 60 minute lower high. The bears hope that this double top leads to a breakout below last week’s low and then a measured move down. If the second leg up stalls again at last week’s high, the Emini will have created a large triangle, which can breakout in either direction.
The S&P500 Emini higher time frame charts (60 minute, daily, and weekly) still look like they will have a second leg down once the 5 minute two-legged rally is finished.
See the weekly update for a discussion of the weekly chart.
Traders can see the end of the day bar-by-bar price action report by signing up for free at BrooksPriceAction.com. I talk about the detailed Emini price action real-time throughout the day in the BrooksPriceAction.com trading room, and a 2 day free trial is available.
When I mention time, it is USA Pacific Standard Time (the Emini day session opens at 6:30 am PST, and closes at 1:15 pm PST). You can read background information on the intraday market reports on the Intraday Market Update page.
Thanks for your kind words momo944. I have passed on message to Al and he is very happy to hear your comment. Al does not have time to read and answer comments himself given his heavy workload.
Richard, BTC Admin.
Just wanted to thank you for these intraday updates Al, they provide so much information and clarity about the context. I`m really starting to get a grasp of things now.