Emini and Forex Trading Update:
Monday April 27, 2020
I will update again at the end of the day.
Pre-Open market analysis
The Emini is in a bull trend on both the weekly and daily charts. Last week was an inside bar on the weekly chart. It is therefore a High 1 bull flag buy signal bar for this week.
Friday was an inside bar on the daily chart. It is also a High 1 buy signal bar.
The 20 week EMA is at 2911 and it is a magnet just above last week’s high. Traders should expect a move above the weekly EMA today or this week.
However, there is a wedge rally on the daily chart. Also, there is now a 6 week bull micro channel on the weekly chart. That is extreme and unsustainable. Consequently, traders should expect this week to rally early and then reverse down at the end of the week or early next week.
Can today be a big bear day? Thursday was a sell signal bar on the daily chart. While it is possible, The Emini is more likely to be sideways to up today. It should rally to at least a little above the 20 week EMA this week before sellers will consider becoming aggressive.
Overnight Emini Globex trading
The Emini is up 28 points in the Globex session. It will therefore probably gap above Friday’s high and trigger the daily buy signal.
It is just a few points below last week’s high. If it gaps above it or trades above it, the Emini will also trigger the weekly buy signal.
With the daily and weekly charts having buy signals in bull trends and magnets above, there is an increased chance of a bull trend day today. Can we see the opposite? Of course, especially since the 5 minute chart was in a buy climax on Friday. But the odds favor a move above resistance at some point this week. This is true even if there is a bear day 1st.
Friday’s setups

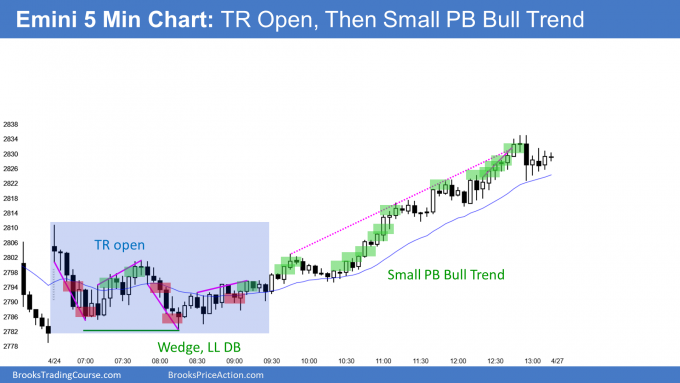
Here are several reasonable stop entry setups from Friday. I show each buy entry with a green rectangle and each sell entry with a red rectangle. I rarely also show limit order entries and entries on the close of bars. Buyers of the Brooks Trading Course and Encyclopedia of Chart Patterns have access to a much more detailed explanation of the swing trades for each day (see Online Course/BTC Daily Setups).
My goal with these charts is to present an Always In perspective. If a trader was trying to be Always In or nearly Always In a position all day, and he was not currently in the market, these entries would be logical times for him to enter.
If the risk is too big for your account, you should wait for trades with less risk or trade an alternative market like the Micro Emini.
EURUSD Forex market trading strategies

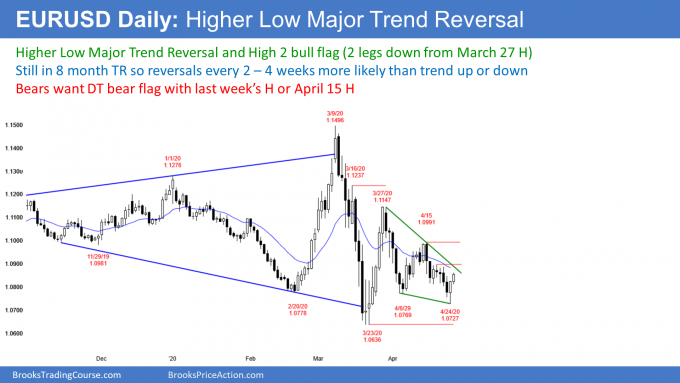
The EURUSD Forex market on the daily chart today triggered a higher low major trend reversal buy signal by going above Friday’s high. The month-long selloff had 2 legs down from the March 27 strong rally. It is therefore also a High 2 bull flag buy signal.
Friday was a strong buy signal bar. Traders expect 2 – 4 weeks of sideways to up trading. However, if the rally turns down from resistance, there could be another brief leg down to below last week’s low. If so the month-long bear channel would then probably evolve into a wedge bottom instead of a High 2 bottom.
The chart has been in a trading range for 8 months. Consequently, traders keep looking for legs up and down to reverse every few weeks. This is a good candidate for the start of a leg up. But they also expect disappointment.
There is nearby resistance. This includes the month-long bear trend line, the daily and weekly EMAs, and last week’s high. However, the bears need a strong break below the March low before traders will conclude that a leg up is not imminent.
If the bulls get a series of strong bull days, the rally will probably quickly test the March 27 high. But look at the past month. The bars are small and have prominent tails. They mostly overlap one another. This is trading range price action. Therefore, the rally will probably not race higher.
Traders will be hesitant until they see clear strength. They expect a pause for several days this week for a possible attempt at a double top bear flag at resistance. That will make the bulls quick to take profits.
Overnight EURUSD Forex trading
The 5 minute chart of the EURUSD Forex market has rallied for 2 days in a Spike and Channel bull trend. That typically is followed by a break below the bull channel and then a transition into a trading range.
While today triggered a buy signal on the daily chart, the EURUSD has traded sideways in a a 30 pip range overnight. Day traders have been scalping reversals up or down for 10 – 20 pips.
This is because they see that the daily chart is near resistance and the past month has had mostly trading range price action. They expect the 2 day rally to stall here or around last week’s high.
Day traders are willing to swing trade, but they need to see a series of strong trend bars breaking far above or below the overnight range. That is unlikely. Today will probably remain a trading range day.
Summary of today’s S&P Emini futures price action and what to expect tomorrow

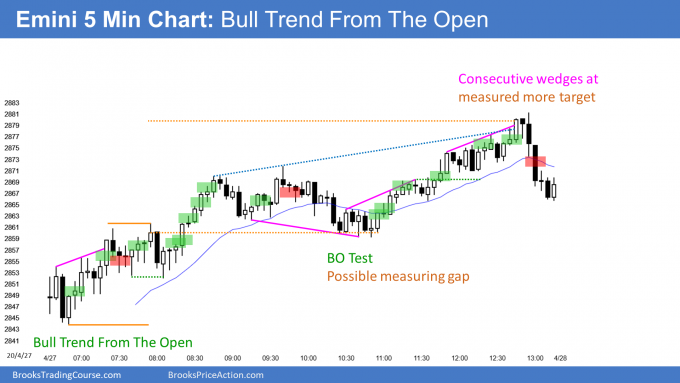
Here are several reasonable stop entry setups for today. I show each buy entry with a green rectangle and each sell entry with a red rectangle. I rarely also show limit order entries and entries on the close of bars. Buyers of the Brooks Trading Course and Encyclopedia of Chart Patterns have access to a much more detailed explanation of the swing trades for each day (see Online Course/BTC Daily Setups).
My goal with these charts is to present an Always In perspective. If a trader was trying to be Always In or nearly Always In a position all day, and he was not currently in the market, these entries would be logical times for him to enter.
If the risk is too big for your account, you should wait for trades with less risk or trade an alternative market like the Micro Emini.
End of day summary
The Emini had a weak rally and then went sideways for a couple hours. After trend resumption up, there was a small selloff into the close. By going above last week’s high, it triggered the weekly buy signal.
Traders should expect the Emini to reach the 20 week EMA at some point this week. It is currently at 2901, which is less than 20 points below today’s high.
However, the Emini will probably then begin a 2 – 3 week reversal down. The Emini should remain in a trading range all year.
See the weekly update for a discussion of the price action on the weekly chart and for what to expect going into next week.
Trading Room
Traders can see the end of the day bar-by-bar price action report by signing up for free at BrooksPriceAction.com. I talk about the detailed S&P Emini futures price action real-time throughout the day in the BrooksPriceAction.com trading room. We offer a 2 day free trial.
Charts use Pacific Standard Time
When I mention time, it is USA Pacific Standard Time (the Emini day session opens at 6:30 am PST, and closes at 1:15 pm PST). You can read background information on the intraday market reports on the Market Update page.


Hello Al, I am an active member of your traderoom and also studying your course material at the moment, you showed last week that you were holding an OIL ETF during one of your webinars and I think it was USO, am I correct? Do you recommend buying and holding OIL stocks since oil has plunged and what are those that you’d recommend to buy and hold? thank you – Hope
I talked about this in the trading room. I said that I manage a $5 stock or ETF as if it were a call option rather than as a stock.
My general rule when I trade options is to exit if the option loses about half of its value. I mentioned in the trading room that I exited with a loss yesterday. Once it fell 50% from my purchase price last week, I waited for a bounce that would allow me to exit with a smaller loss, which I did.
USO is an unusual ETF because it is based on crude oil futures rather than stocks. That increases the risk.
For example, the May futures contract fell to negative $40 last week. The company that runs the USO had to quickly change how it was calculated because they could not have an ETF fall to below zero.
That ETF is so discredited that I do not think it will survive. However, it was very popular and I think some company will come up with a replacement. But the replacement cannot be too closely based on the front month.
Beyond that, there are several other energy ETFs that are based on stocks and they don’t have the same risk of falling to zero. The XLE is an obvious one. It is currently up 40% off the March low.