Market Overview: NASDAQ 100 Emini Futures
The NASDAQ Emini futures reversed this week with a small bear body and a big tail at the bottom.
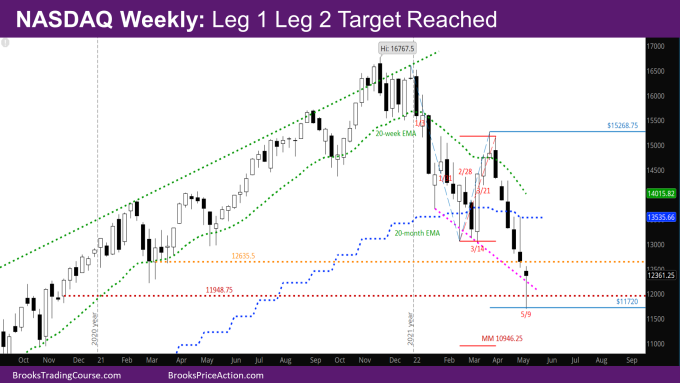
NASDAQ weekly bear reversal with market reaching all targets mentioned last week on the weekly chart. It is reversing after reaching the Leg1 Leg2 target of 11720.
A reversal here will likely be a minor reversal and it is still valid that there will be a 2nd leg down to the current weekly bear leg.
NASDAQ 100 Emini futures
The Weekly NASDAQ chart

- This week’s NASDAQ candlestick is a reversal bar with a small body and a big tail at the bottom.
- The market made all the targets mentioned below from previous weeks –
- March 2021 open at 12635.5 – met last week
- November 2020 open at 11948.75 – met this week
- Leg 1 Leg 2 move at 11720 – met this week
- The week is also reversing after an overshoot of the trend channel line
- It is still likely that there will be a second leg down from this bear leg, even if there are one or two pause weeks in the next couple of weeks. Minimally, we need a micro double bottom for a credible reversal.
- The downward slope of the weekly exponential moving average (EMA) is quickly getting steeper. The bulls need to create successive equal sized bull bars that are not too big (to not attract profit takers). This will start flattening the weekly EMA as it gets closer to monthly EMA.
- Bull upside targets that are interesting for the rest of this month – the daily EMA at 12950; the open of the month at 12841 and the monthly EMA at 13535.
- Ideally, the bulls want the month to close above the monthly EMA to avoid consecutive bear close below monthly EMA. Minimally, they want a bull bar. The likelihood of a bull month close is 60%, while closing above monthly EMA is 40%.
- The next target for the bears would be the measured move (MM) down of the double bottom (DB) on monthly chart at 10946.25, or the open of the November 2020 month at 11139.5.
- November 2020 is when the spike on monthly chart started after the sideways months of September and October. Likelihood of these targets being met is 50-60%.
- If the month ends up a doji below the EMA, there will be a big tail on top, which means next couple of months will be sideways to down.
The Daily NASDAQ chart

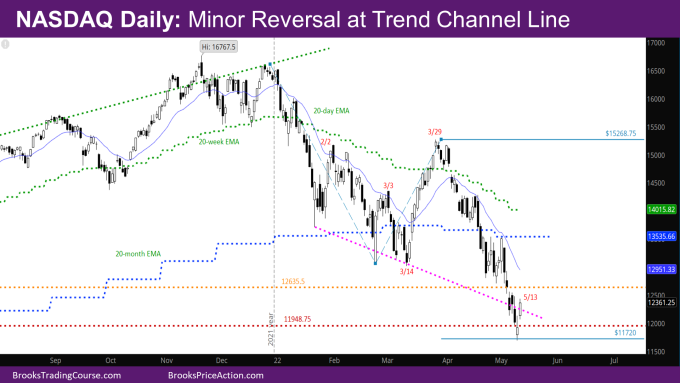
- Friday’s NASDAQ candlestick is a bull trend bar with a small tail at the top.
- The week started with three bear days. Thursday was a bull reversal day although with a big tail on top, and Friday was a strong bull day. Given Thursday’s bull reversal was after 5 bear days, it is likely this is a minor reversal.
- As mentioned last week, the daily EMA is below the monthly EMA. The last time the daily EMA spent significant time below the monthly EMA happened in 2018 and 2015. It took about 21 days for the daily EMA to cross back over the monthly EMA – and many of those days had to be bull days.
- The daily EMA will now act as resistance. What will be ideal for bulls is if the daily EMA and monthly EMA come close enough that the market crosses back above both like it did back on March 16th.
Market analysis reports archive
You can access all weekend reports on the Market Analysis page.


Hi Rajesh,
Thank you for your very interesting analysis!
How do you think is it ok to use NQ charts as a leading indicator for SPY (or SPX) trades on Weekly and Daily TF?
best regards,
Murat
The NQ and ES act very similarly most days. If you see their charts side by side at the end of the day, you will see they are similar on most days. So in that way, you could use either chart as a leading indicator. One interesting example is that the NQ pierced the monthly EMA back in March; whereas the ES did not. This was one hint that the low was not in for the ES back in March (as strong as the bull reversal was), as it also very likely needed to test the monthly EMA.