Market Overview: Nifty 50 Futures
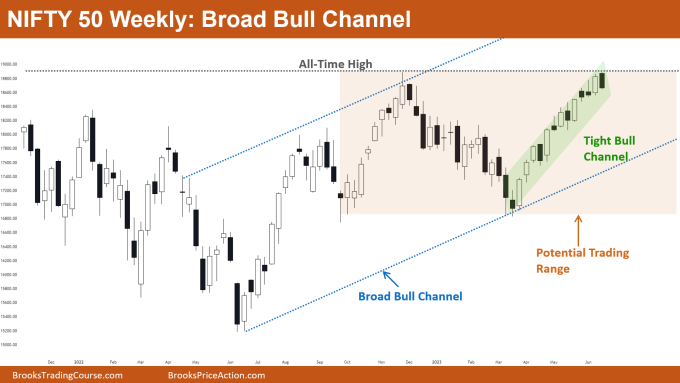
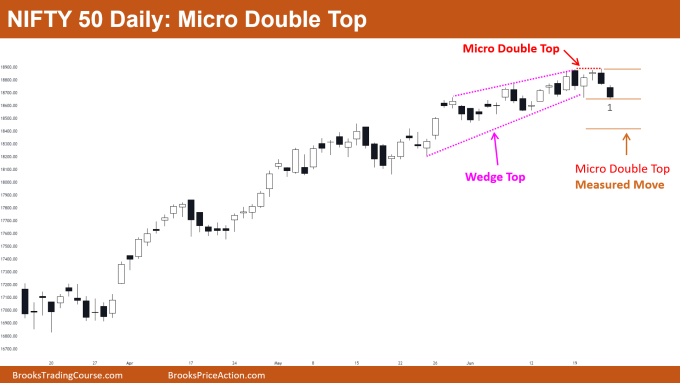
Nifty 50 Broad Bull Channel on the weekly chart. This week, the market gave a strong bearish close and is currently trading inside a strong, tight bull channel. The bulls tried to break above the all-time high and give a strong close this week, but they were unsuccessful. The bears are attempting to give a strong bear breakout of the neckline of the micro double top pattern on the daily chart of the Nifty 50 after they gave a bear breakout of the wedge top.
Nifty 50 futures
The Weekly Nifty 50 chart

- General Discussion
- The market has finally formed a strong bear bar, which may tempt bears to short the market.
- Selling at the low of this bear bar would not be a high probability trade because the channel is strong.
- Bears should hold off on selling until they see a strong follow-through bar in order to get a high probability sell.
- Bulls should hold off on buying despite the fact that the market is currently trading inside of a strong, tight bull channel because it is currently below a strong resistance, which could result in a big trading range.
- Long-term bulls may close out their trades at or below the low of the strong bear bar.
- Deeper into the price action
- The market is going through frequent large moves up and down while trading inside of a broad bull channel (indicated by the blue text).
- Chances are very high that the market is trading inside of a trading range or broad channel whenever you observe big up and down moves.
- The market is forming a broad bull channel if higher highs and lower lows are being formed, a broad bear channel if lower lows and lower highs are being formed, and a trading range if all of the swing highs and lows are forming at or near the same price level.
- When the market is typically trading within a trading range:
- Bulls buy near the trading range low and sell near the trading range high.
- Bears sell near the trading range top and buy near the trading range low.
- A similar price action, in which bulls buy low and sell high and bears sell high and buy low, is seen in the context of the broad bull channel.
- But chances of a move up or down are nearly equal when the market is trading close to the middle of the broad channel.
- Looking at the above chart, you can see that the market is currently trading close to the middle of the broad bull channel, indicating that there is a good chance that it will move either up or down.
- As a result, some trading range price action is expected on the shorter time frame.
- Patterns
- The market is trading in both a tight nested bull channel and a broad bull channel.
- If the bears are able to provide a strong follow-through bar, the likelihood of a bear breakout of the tight bull channel will rise.
The Daily Nifty 50 chart

- General Discussion
- The market is in a strong bull trend on the daily chart.
- The market demonstrated a bear breakout of the wedge top and provided strong follow-through bars.
- Therefore, the bears can short the market at the low of bar 1 and anticipate at least a micro double top measured move.
- Bulls with long positions should close their positions at the low of bar 1.
- Deeper into price action
- Because of how big and strong the bull trend is, there is very little chance that it will reverse by the micro double top.
- Bears need at least a double top to bring about a major trend reversal, so traders should anticipate at least another bull leg up before the market exhibits a major trend reversal.
- If the market displays strong, consecutive bull bars after reaching the micro double top measured move target, bulls may look to buy once more.
- Patterns
- The market cycle theory states that there is a strong likelihood of a trading range following a market breakout from a channel.
- Bearish breakout of the wedge top may result in a trading range because a wedge is also a type of channel.
- So, rather than anticipating a significant trend reversal, bears who are selling at the low of bar 1 should look to exit their trades once the market reaches the measured move or close to the bottom of the wedge top.
Market analysis reports archive
You can access all weekend reports on the Market Analysis page.

