Market Overview: Nifty 50 Futures
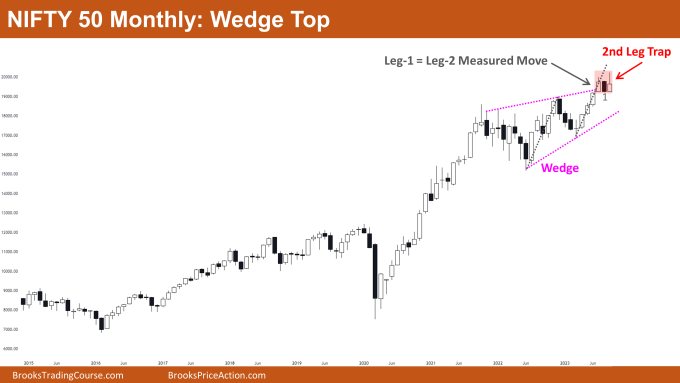
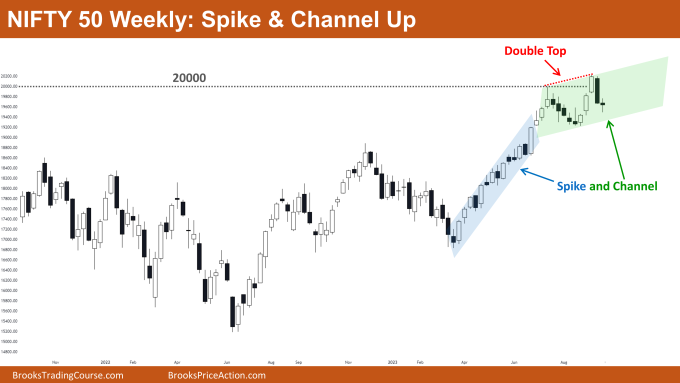
Nifty 50 Wedge Top on the monthly chart. This month, the market closed with a weak bullish candle and a long tail at the top. After the powerful bull leg, the bulls were unable to form a second leg. Bulls may have sold their long positions because the monthly chart also hit the leg-1 = leg-2 measured move target, which caused the bar’s top to have a tail. On the weekly chart, the Nifty 50 produced a weak bear close. If bears are unable to provide a strong bear close, the market may spike and channel up again in the bull channel.
Nifty 50 futures
The Monthly Nifty 50 chart

- General Discussion
- Because of the market’s strong bull trend, sellers should refrain from selling.
- Bulls should buy when bear attempts to breakout fail, during feeble pullbacks, or on a high-1 or high-2 entry bar.
- Because the market is close to the wedge top and has reached the measured move target, traders should prepare for a pullback.
- Deeper into the price action
- There are currently fewer chances of a reversal because the final bull leg in the wedge top is very strong.
- Although bears were able to get a strong bear close (bar-1 in the image above), they were unable to get a strong follow through.
- Even if bears are able to get two consecutive bear bars and a very strong pullback, the best they can hope for is a trading range rather than a reversal.
- Patterns
- Because the market is currently trading inside of a wedge top, traders should soon anticipate a slight retracement to the wedge pattern’s bottom trendline.
- The market has also reached the target for the leg-1 = leg-2 measured move, and some bulls may be tempted to cut their long positions, which could increase the likelihood of a pullback.
The Weekly Nifty 50 chart

- General Discussion
- The market has been trading pretty much at the same price level (i.e., 20000) for the past few weeks, which suggests that the market is trading in a trading range or in a broad channel.
- The buy low sell high trading strategy should be used by bulls and bears who trade on shorter time frames (such as the daily chart).
- Deeper into price action
- Overlapping body bars have formed in the market over the past 10 to 12 weeks; this could be a sign of a potential trading range.
- Even after strong closes, neither the bulls nor the bears are able to get strong follow-through bars.
- Chances of a double top measured move down will rise if the bears are successful in obtaining a third straight bear bar.
- Patterns
- On the weekly chart, the bulls could only manage one close above the big round number 20000.
- The market is currently trading inside of a bull channel after the bull spike, so traders should concentrate on buying low and selling near the high of the channel.
- Since the market has recently begun to form deeper pullbacks within the bull trend, the likelihood of a trading range is high.
Market analysis reports archive
You can access all weekend reports on the Market Analysis page.