Market Overview: Nifty 50 Futures
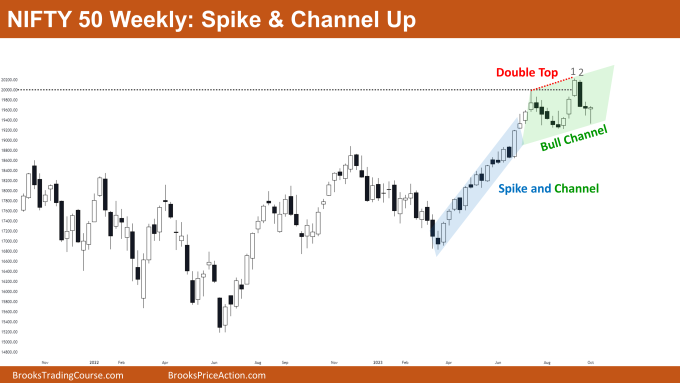
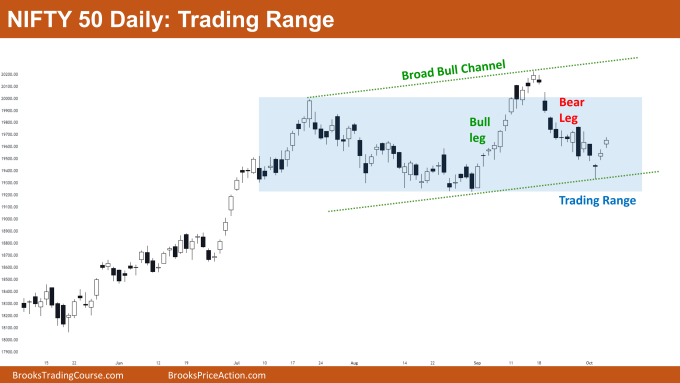
Nifty 50 Spike and Channel Up on the weekly chart. On the weekly chart, the market provided a bullish close with a long tail at the bottom, and it is currently trading close to the bottom trendline of the bull channel, suggesting that bulls may buy at the high of this week’s close. Bears established a double top pattern in order to bring about a reversal, but they were unable to do so. On the daily chart, the Nifty 50 is trading inside a broad bull channel. Bulls need strong bull bars to reach the top of the trading range or the upper trendline of the broad bull channel because the reversal bars (near the channel bottom) have small bodies.
Nifty 50 futures
The Weekly Nifty 50 chart

- General Discussion
- The market has been fluctuating around the same levels for several weeks, indicating that it is operating within a tight trading range.
- Therefore, until the market forms strong consecutive bars on either side, traders should avoid swing positions and instead favour scalps.
- Buying at the highs of bars in a tight trading range gives you a bad risk to reward ratio, so consider different entry strategies to enter a position.
- Deeper into the price action
- The market demonstrated a strong bull breakout of the big round number 20000 (see bar 1), but bulls were unable to produce strong follow-through bars.
- In a similar way, the bears were successful in forming a double top thanks to a solid bear bar (see bar 2), but they, too, were unable to secure a strong follow-through bar.
- This demonstrates that both bulls and bears are confused, which results in trading range.
- Patterns
- Bears attempted to reverse the trend by forming a double top pattern, but they were unable to secure strong follow-through bars.
- Following the bull spike, the market is currently trading inside of the (blue-colored) tight bull channel.
The Daily Nifty 50 chart

- General Discussion
- The market is trading within a trading range and is currently near the bottom of the range.
- The bulls can buy on the next open and target for the trading range top or the high of the broad bull channel.
- Bears should hold off on selling because the market is currently trading close to the bottom of the bull channel and trading range.
- Deeper into price action
- Pay attention to the bull and bear legs marked on the chart. Strong legs on both sides.
- However, there is a very high likelihood of a trading range forming whenever strong bull and bear legs follow one another.
- The “V-pattern” is a common name for this pattern. It is forming an inverted “V-pattern” in the example above.
- The reversal attempt is very weak in comparison to the bear leg, as shown by the three most recent bars (on the right).
- This indicates that there is a high likelihood of a second leg down prior to a bull turn. Bulls may want to hold off on making a purchase for the trading range top until after a second leg down.
- Patterns
- Trading is taking place inside of a broad bull channel. Before reversing, it might offer a second leg down.
- Bulls have the option of buying at the open or waiting for a double bottom. Keep in mind that a double bottom essentially denotes a reversal following a second leg down.
Market analysis reports archive
You can access all weekend reports on the Market Analysis page.