Market Overview: Nifty 50 Futures
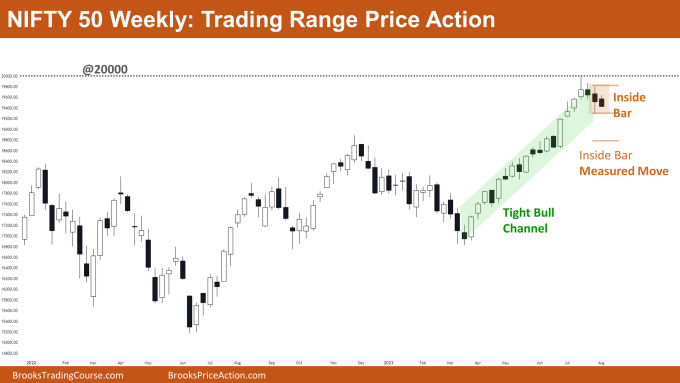
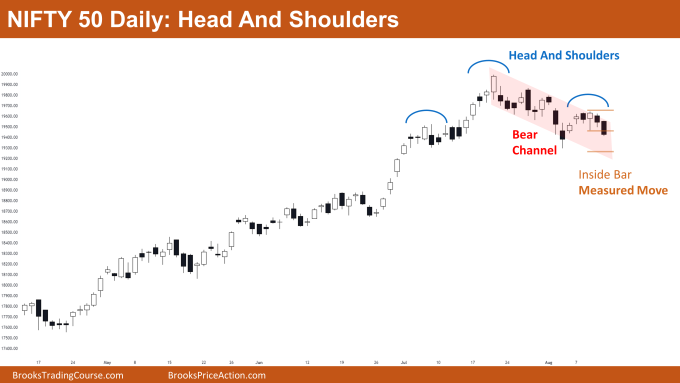
Nifty 50 Trading Range Price Action on the weekly chart. This week, the market created a small bear bar that closed close to its low and an inside bar pattern that could signal a gradual decline. The tight bull channel in which the weekly is still trading makes it more difficult for bears to sell the market. If bears are able to give a strong breakout and a follow-through on the daily chart of the Nifty 50, this could result in a trend reversal. The Nifty 50 is forming a large head and shoulders pattern.
Nifty 50 futures
The Weekly Nifty 50 chart

- General Discussion
- There is almost no room for the bears to sell profitably as the market is trading close to the bottom of the tight bull channel.
- The tight bull channel’s bottom trend channel line, as well as the first (high-1) or second (high-2) entries, are potential entry points for bulls.
- Bears should not be entering until market forms a fourth consecutive big bear bar closing near its low.
- Deeper into the price action
- Nifty 50 is trading near the big round number which increases the probability of market going sideways.
- Market has clearly started forming trading range price action like; tails above and below bars, overlapping bodies of the bars.
- The tight bull channel is very strong, so probability of a reversal on the first reversal attempt is less likely.
- Probability of a 2nd leg up before a reversal is more likely.
- Patterns
- Market formed two consecutive inside bar patterns, this is a sign of trading range price action.
- As market is trading near the big round number, traders can expect trading range price action for next few weeks on the weekly chart.
The Daily Nifty 50 chart

- General Discussion
- Nifty 50 is trading inside the bear channel, and currently is trading close to the neck of head and shoulders pattern.
- Both bulls and bears should wait before initializing a fresh position.
- If market is not able to give a bear breakout of the head and shoulders, but instead forms strong bull bars, then bulls can buy.
- Bears can sell the market if it gives a strong bear breakout of the head and shoulders pattern with a follow-through bar.
- Deeper into price action
- In the last 10 to 15 bars bulls have not been able form a strong bull bar, so a strong bear breakout of the neckline might attract bears to sell for a trend reversal.
- If bears are not able to give a successful breakout or bulls are able to give a bull breakout of the bear channel then chances of a big trading range (equivalent to the height of the bear channel) are higher.
- With respect to previous reversal attempts (which were small and weak), this time bears were able to give a reasonably big reversal attempt (head and shoulders) which has the potential to reverse the market.
- Patterns
- A head and shoulders pattern is a breakout mode pattern which has around 50% chances of successful breakout.
- As the bull trend is strong, the bears who are selling the bear breakout of the head and shoulders pattern should maintain a high risk reward ratio for a positive traders equation.
- Inside the bear channel the market has also formed a inside bar which can lead to a measured move down.
Market analysis reports archive
You can access all weekend reports on the Market Analysis page.
Hello Rishi, as does, I suppose, Albrooks provide daily setup charts of E Mini to his paid subscriber, do you provide daily set up charts for Nifty 50
Hello Ashish, I do not provide daily set up charts for Nifty 50.