Market Overview: Nifty 50 futures
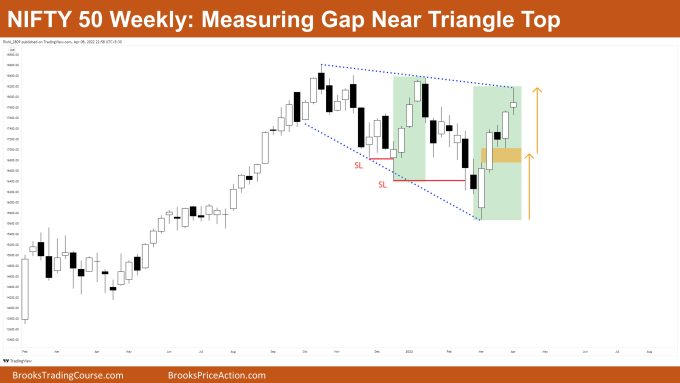
Nifty 50 futures measuring gap near 17900 with a weak bull bar at the top of an expanding triangle, and overall NIFTY 50 remained up by 1% this week.
Nifty 50 futures
The Weekly Nifty 50 chart

- Deeper into the price action
- Last few bars have been closing near their highs (shown in green box)
- Whenever bars close near their highs then avoid going against them.
- If you notice the last two SL (Swing Low ) you would see that BULLS are aggressively buying the LOWS on LIMIT orders this clearly means that this is a limit order market
- And what does a limit order market mean? This simply means that the market is in a trading range
- Patterns
- A measuring gap was observed (marked with orange) with a measured move near the top of the EXPANDING TRIANGLE
- Stairs pattern is also seen i.e., market retraces back the breakout levels (marked with red) which just means that the breakouts are weak and would not lead to a TREND but would probably lead to a TRADING RANGE or REVERSAL
- Pro Tip
- Always avoid entering with stop order when the market is a limit order market
- This means that market is in a trading range and you are trading it like in a breakout phase which is completely wrong
The Daily Nifty 50 chart

- Deeper into the price action
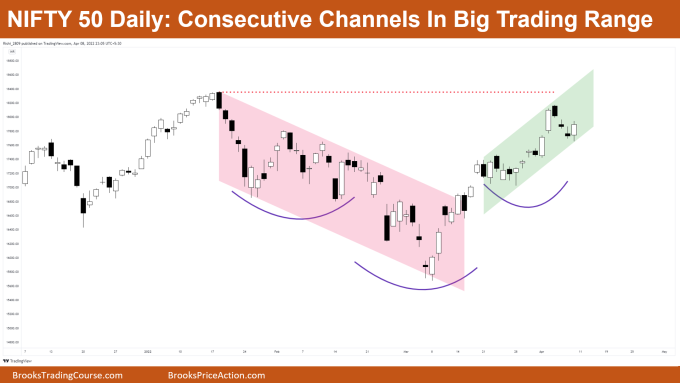
- Market has still not breached the all-time high and is still in a big TRADING RANGE
- NIFTY 50 is in a channel → Range phase
- In channel and range phases you always buy near the lows of the channel / range and short near the high of the channel / Range
- If you carefully analyze the whole chart no breakouts have resulted in any follow-through
- When that is the case, you never BUY the upside breakouts and never SELL downside breakouts. You always have to fade the breakouts in these kinds of conditions
- Patterns
- Two consecutive channels seen which clearly means market is in a trading range
- Market is making rounded consecutive bottoms (purple color) i.e. inverted head and shoulders. Always be alert when taking breakouts of large patterns as probabilities are less and thus you need to INCREASE your Risk to Reward
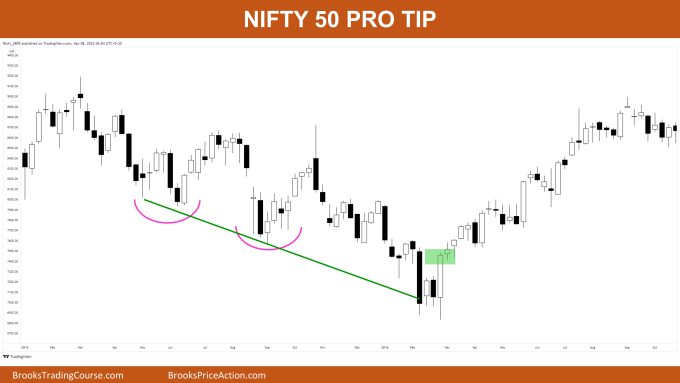
- Pro Tip (see image below)
- Whenever you see TWO consecutive SWINGS like here (marked with pink) then join and extend them in future
- See how they react, like here a BIG bull bar at wedge bottom… BUY! (Marked with green box)

Market analysis reports archive
You can access all weekend reports on the Market Analysis page.