Trading Update: Monday October 14, 2024 End of day video review S&P Emini market analysis Emini daily chart Emini 5-minute chart and what to expect today Friday’s Emini setups Al created the SP500 Emini charts. Here are reasonable stop entry setups from Friday. I show each buy entry bar with a green arrow and each […]
If you are not seeing the latest Weekly Report below, your PC/device browser is likely showing you an earlier page copy. Simply refresh your browser. For PCs you can use the F5 key, or Ctrl-F5, several times if needed.
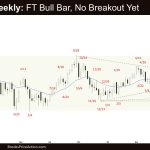
FTSE 100 Weekly Failed BO below Inside Bar, MA and Bull Channel
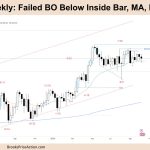
Market Video Overview: FTSE 100 Futures Tim Fairweather’s weekly report on the FTSE 100 futures market. FTSE 100 report AI transcript Hi everyone and welcome back to another Brooks Trading Course weekend market update. My name is Tim Fairweather. I’m a professional price action day trader. And today I’m going to cover the FTSE 100 […]
DAX 40 Bull Breakout, Pullback, Test BO Point, Gap, H1
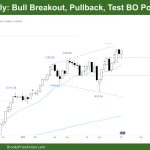
Market Video Overview: DAX 40 Futures Tim Fairweather’s weekly report on the DAX 40 futures market. DAX 40 report AI transcript Hi everyone. And welcome back to another Brooks trading course, weekend market update. My name is Tim Fairweather. I’m a professional price action day trader. And this week I’m going to cover the DAX […]
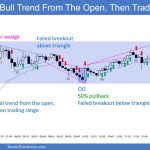
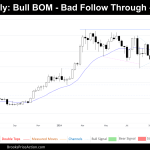
Weekly Emini Breakout
Market Overview: S&P 500 Emini Futures The market formed a weekly Emini breakout into new all-time high. The bulls want another leg up completing the wedge pattern with the first two legs being March 21 and July 16 highs and the embedded wedge in the current leg up with the first two legs being August […]
Weekly Crude Oil Follow-through
Market Overview: Crude Oil Futures The market formed a weekly Crude Oil follow-through bull bar closing above the 20-week EMA. The bulls must create consecutive bull bars closing near their highs to increase the odds of a breakout above the triangle top. The bears see the recent move as a two-legged pullback (Sep 24 and […]
Weekly EURUSD Bears need Follow-through
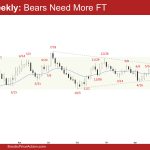
Market Overview: EURUSD Forex The weekly Eurusd bears need follow-through selling next week to increase the odds of a bear leg. The bulls see the last two weeks as a pullback and retest of the breakout point. They want the market to form a higher low, followed by a retest of the September 25 high […]
Bitcoin weekly limit order Trading Range testing $65000
Market Overview: Bitcoin Bitcoin‘s weekly chart is currently exhibiting a lack of momentum, much to the dismay of traders who anticipate a test of the all-time high in the near future. The market is stuck in a limit order trading range. Following a strong bull breakout earlier, a wedge bottom pattern continues to influence its […]
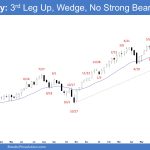
Nasdaq 100 Third Leg up From 8-5
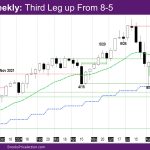
Market Overview: NASDAQ 100 Emini Futures The NASDAQ Emini futures week is a bull bar with a tail below. It represents the third leg up from 8-5. On the daily chart, the market continues its bull channel phase above the exponential moving average (EMA). NASDAQ 100 Emini futures The Weekly NASDAQ chart The Daily NASDAQ […]
Nifty 50 Micro Double Bottom
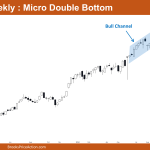
Market Overview: Nifty 50 Futures Nifty 50 Micro Double Bottom on the weekly chart. The market on the weekly chart closed with a weak bearish candle, showing a tail at the bottom. This week’s candle is forming a micro double bottom pattern with the previous swing low. Overall, the market remains in a strong bullish […]
Strong Rally from Open to New All Time High
Trading Update: Friday October 11, 2024 End of day video review Follow Joseph’s YouTube channel for more Al Brooks price action analysis. S&P Emini market analysis Apologies but due to Brad travelling there will be no written report for today. Yesterday’s Emini setups Al created the SP500 Emini charts. Here are reasonable stop entry setups […]

