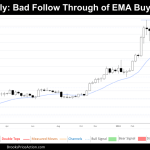
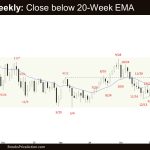
Market Overview: Bitcoin On the weekly chart of Bitcoin, a failed bullish reversal confirms the persistence of the limit order market, highlighting the need for patience and strategic decision-making. Meanwhile, the daily chart paints a picture of a potential turning point, as bulls defend critical support levels and bears test their resolve. Will a decisive […]
If you are not seeing the latest Weekly Report below, your PC/device browser is likely showing you an earlier page copy. Simply refresh your browser. For PCs you can use the F5 key, or Ctrl-F5, several times if needed.
FTSE 100 Breakout and FT, MM Up, Possible 3rd Leg
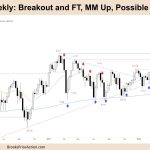
Market Overview: FTSE 100 Futures FTSE 100 futures went higher last week in a bull breakout and a follow-through. Bull breakouts on the monthly, weekly and daily chart after bears gave up defending the top of the trading range. Climactic on the daily chart so we should see some profit-taking soon, but nothing to sell, […]
DAX 40 Bull Spike and Channel, Sideways to Up
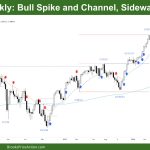
Market Overview: DAX 40 Futures DAX futures went higher last week in a bull spike and channel. Its had two clear legs up which were very steep. Bears got two legs sideways which could be the end of the second leg. It is important to see if bulls create a follow-through bar next week as […]
Nasdaq 100 Back in the Area of Trading Range from March
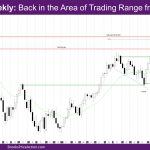
Market Overview: NASDAQ 100 Emini Futures The NASDAQ Emini futures week is a bull bar with a prominent tail above. The market is back in the area of trading range from March. On the daily chart, Monday was a good follow-through bar to last Friday’s bull entry bar. The rest of the week was trading […]
Emini Follow-through after High 1
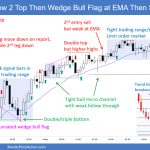
Trading Update: Friday May 10, 2024 S&P Emini pre-open market analysis Emini daily chart Emini 5-minute chart and what to expect today Emini Intra-Day Update Yesterday’s Emini setups Al created the SP500 Emini charts. Here are reasonable stop entry setups from yesterday. I show each buy entry bar with a green arrow and each sell […]
Emini High 1 Buy Signal Bar
Trading Update: Thursday May 9, 2024 End of day video review S&P Emini pre-open market analysis Emini daily chart Emini 5-minute chart and what to expect today Yesterday’s Emini setups Al created the SP500 Emini charts. Here are reasonable stop entry setups from yesterday. I show each buy entry bar with a green arrow and […]
Emini Buyers below Yesterday’s Low
Trading Update: Wednesday May 8, 2024 End of day video review S&P Emini pre-open market analysis Emini daily chart Emini 5-minute chart and what to expect today Emini Intra-Day Update Yesterday’s Emini setups Al created the SP500 Emini charts. Here are reasonable stop entry setups from yesterday. I show each buy entry bar with a […]
Emini Second Leg Up Likely
Trading Update: Tuesday May 7, 2024 S&P Emini pre-open market analysis Emini daily chart Emini 5-minute chart and what to expect today Emini Intra-Day Update Yesterday’s Emini setups Al created the SP500 Emini charts. Here are reasonable stop entry setups from yesterday. I show each buy entry bar with a green arrow and each sell […]
Emini Bull Breakout of Bear Flag
Trading Update: Monday May 6, 2024 S&P Emini pre-open market analysis Emini daily chart Emini 5-minute chart and what to expect today Emini Intra-Day Update Friday’s Emini setups Al created the SP500 Emini charts. Here are reasonable stop entry setups from Friday. I show each buy entry bar with a green arrow and each sell […]
Crude Oil Lower High
Market Overview: Crude Oil Futures The monthly chart formed a Crude Oil lower high in April. The bears want April to reverse back below the 20-month EMA and form a second leg sideways to down to retest the December low from a lower high major trend reversal (Apr 12). The bulls hope that the current sideways-to-down move is simply […]

