Trading Update: Tuesday April 30, 2024 S&P Emini pre-open market analysis Emini daily chart Emini 5-minute chart and what to expect today Emini Intra-day update Friday’s Emini setups Al created the SP500 Emini charts. Here are reasonable stop entry setups from Friday. I show each buy entry bar with a green arrow and each sell […]
If you are not seeing the latest Weekly Report below, your PC/device browser is likely showing you an earlier page copy. Simply refresh your browser. For PCs you can use the F5 key, or Ctrl-F5, several times if needed.
Emini Testing Moving Average
Trading Update: Monday April 29, 2024 S&P Emini pre-open market analysis Emini daily chart Emini 5-minute chart and what to expect today Emini Intra Day Update Yesterday’s Emini setups Al created the SP500 Emini charts. Here are reasonable stop entry setups from yesterday. I show each buy entry bar with a green arrow and each […]
Emini Inside Bar
Market Overview: S&P 500 Emini Futures The market formed a Weekly Emini inside bar closing near its high, forming a pullback from around the 20-week EMA. The bulls want a breakout above the inside bull bar with strong follow-through buying next week and a strong retest of the March 21 high. The bears want at least a […]
Crude Oil Bull Channel
Market Overview: Crude Oil Futures The weekly chart formed a Crude Oil bull channel and a bull leg within a trading range. The bears see this week simply as a pullback and want at least a small second leg sideways to down. The bulls want a retest of the September 28 high after the current pullback. If […]
EURUSD Breakout Test or Stalling?
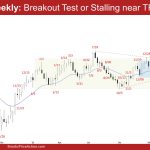
Market Overview: EURUSD Forex The weekly chart formed consecutive doji(s) and traders are wondering if the market is forming a EURUSD breakout test or stalling around the lower third of the trading range. The bulls need to create consecutive bull bars closing near their highs and trading above the 20-week EMA to indicate they are back in control. The bears want to […]
Bitcoin’s Weekly High 3 Falters: Will Bears Seize Control?
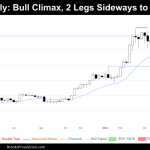
Market Overview: Bitcoin Bitcoin painted a picture of a market in transition. While a High 3 buy setup emerged, it was followed by bearish signals and hints of a potential buy climax. This suggests the possibility of evolving into a trading range, especially after a strong bull trend. While uncertainty remains, both bulls and bears […]
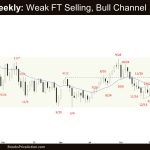
FTSE 100: Strong Breakout New All Time High
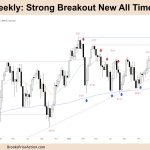
Market Overview: FTSE 100 Futures FTSE 100 futures went higher with a strong breakout last week. The bears tried to fade the top of the trading range but got run over with a weak signal. As soon as it closed, only buyers took the price higher. Next week, it is important to see if there […]
DAX 40 High 1 After Deep Pullback, Above MA
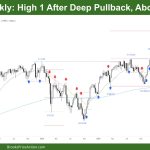
Market Overview: DAX 40 Futures DAX futures went higher forming a High 1 from a reversal up from 18000. Such a strong spike needed a correction and the pullback was deep. It might need a second leg sideways to down before bulls buy again. The moving average is just below and there are likely buyers […]
Nasdaq 100 No CC Close below Nov 2021 Bull Body Gap
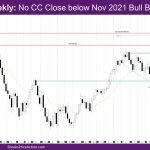
Market Overview: NASDAQ 100 Emini Futures The NASDAQ Emini futures week is an inside bull trend bar with small tails. The market had no CC close below Nov 2021 bull body gap. Note – CC is an abbreviation for consecutive. On the daily chart, the market had a weak two-legged pullback to the exponential moving […]
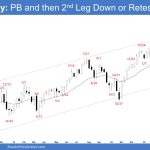
Nifty 50 Trading Range Price Action
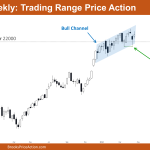
Market Overview: Nifty 50 Futures Nifty 50 Trading Range Price Action on weekly chart. On the weekly chart, the market has shown a small, weak bull bar with a long tail at the top, indicating it remains in a phase of trading range rather than trending. Last week’s micro double bottom formation remains intact, potentially […]

