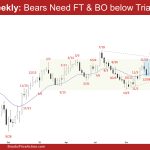
Market Overview: EURUSD Forex The pullback which started in February formed another EURUSD lower high major trend reversal. The bears want a reversal from the upper third of the large trading range and a breakout below the large triangle pattern. The bulls want the 20-week EMA or the bull trend line to act as support. […]
If you are not seeing the latest Weekly Report below, your PC/device browser is likely showing you an earlier page copy. Simply refresh your browser. For PCs you can use the F5 key, or Ctrl-F5, several times if needed.
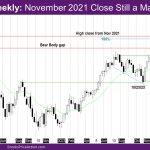
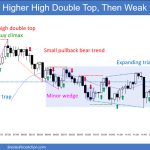
Bitcoin end of the 7-week bull micro channel
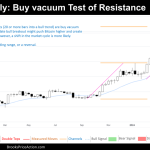
Market Overview: Bitcoin Bitcoin faces a potential trend reversal after failing to sustain momentum above its previous all-time high. This week’s price action dipped below the prior low, snapping a seven-week winning streak on the weekly chart. Our previous analysis anticipated aggressive bears selling a doji bar after a buy vacuum test of resistance, and […]
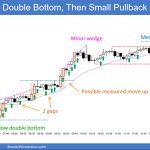
Nifty 50 Weekly Double Bottom
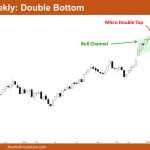
Market Overview: Nifty 50 Futures Nifty 50 Double Bottom on the weekly chart. This week witnessed intriguing developments in the market. A bull bar with a small body and a bottom tail formed, signaling a weak follow-through attempt by the bears aiming for a reversal. Additionally, a double bottom pattern emerged, indicative of potential bullish […]
FTSE 100 Bull Surprise Breakout, Top of TR
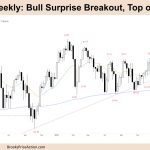
Market Overview: FTSE 100 Futures FTSE 100 futures moved a lot higher last week with a huge bull surprise breakout. We have been in breakout mode for many months, really, but finally, it broke to the upside strongly. It looks like the bull channel will resume here. Bears want this to be a large double […]
DAX 40 Consecutive Bull Bars, Overshoot MM Target
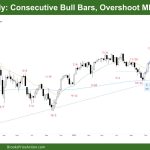
Market Overview: DAX 40 Futures DAX futures moved higher with a follow-through bull bar, so consecutive bull bars above 18000. We had an overshoot on the measured move and now have 3 legs in a tight channel, so we might start to go sideways here soon. Bulls will likely buy the first reversal attempt and […]
Nasdaq 100 Sideways for the Last 4 Weeks Starting 2-26
Market Overview: NASDAQ 100 Emini Futures The NASDAQ Emini futures week is a bull trend bar with a tail above. The market has been sideways for the last 4 weeks starting 2-26. On the daily chart, the market was unable to create consecutive bear bars below the exponential moving average (EMA) and reversed up at […]
Emini Test of Bull Trend Channel Line
Trading Update: Friday March 22, 2024 S&P Emini pre-open market analysis Emini daily chart Emini 5-minute chart and what to expect today Yesterday’s Emini setups Al created the SP500 Emini charts. Here are reasonable stop entry setups from yesterday. I show each buy entry bar with a green arrow and each sell entry bar with […]
Emini Bull Breakout of Triangle
Trading Update: Thursday March 21, 2024 End of day video review S&P Emini pre-open market analysis Emini daily chart Emini 5-minute chart and what to expect today Yesterday’s Emini setups Al created the SP500 Emini charts. Here are reasonable stop entry setups from yesterday. I show each buy entry bar with a green arrow and […]
Emini Bulls Hopeful for Upside Breakout of Triangle
Trading Update: Wednesday March 20, 2024 End of day video review S&P Emini pre-open market analysis Emini daily chart Emini 5-minute chart and what to expect today Yesterday’s Emini setups Al created the SP500 Emini charts. Here are reasonable stop entry setups from yesterday. I show each buy entry bar with a green arrow and […]
Emini Is in Breakout Mode
Trading Update: Tuesday March 19, 2024 S&P Emini pre-open market analysis Emini daily chart Emini 5-minute chart and what to expect today Yesterday’s Emini setups Al created the SP500 Emini charts. Here are reasonable stop entry setups from yesterday. I show each buy entry bar with a green arrow and each sell entry bar with […]

