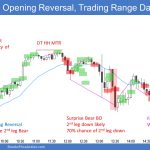
Trading Update: Tuesday June 11, 2024 S&P Emini pre-open market analysis Emini daily chart Emini 5-minute chart and what to expect today Yesterday’s Emini setups Al created the SP500 Emini charts. Here are reasonable stop entry setups from yesterday. I show each buy entry bar with a green arrow and each sell entry bar with […]
Emini Is in Breakout Mode
Trading Update: Tuesday March 19, 2024 S&P Emini pre-open market analysis Emini daily chart Emini 5-minute chart and what to expect today Yesterday’s Emini setups Al created the SP500 Emini charts. Here are reasonable stop entry setups from yesterday. I show each buy entry bar with a green arrow and each sell entry bar with […]
Emini Sideways and Breakout Mode
Trading Update: Monday July 24, 2023 S&P Emini pre-open market analysis Emini daily chart Emini 5-minute chart and what to expect today Friday’s Emini setups Al created the SP500 Emini charts. Here are several reasonable stop entry setups from Friday. I show each buy entry with a green rectangle and each sell entry with a […]
Emini Likely in Breakout Mode
Trading Update: Monday July 10, 2023 S&P Emini pre-open market analysis Emini daily chart Emini 5-minute chart and what to expect today Friday’s Emini setups Al created the SP500 Emini charts. Here are several reasonable stop entry setups from Friday. I show each buy entry with a green rectangle and each sell entry with a […]
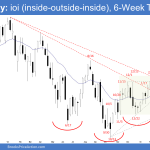
Emini ioi Pattern (inside-outside-inside)
Market Overview: S&P 500 Emini Futures The S&P 500 Emini futures formed an an Emini ioi pattern (inside-outside-inside) on the weekly chart which means the market is in a breakout mode. However, the market is also in a 6-week tight trading range and the Emini is currently trading around the middle of it which is […]
Emini Breakout Mode on Daily Chart
Trading Update: Friday May 12, 2023 S&P Emini pre-open market analysis Emini daily chart Emini 5-minute chart and what to expect today Yesterday’s Emini setups Richard created the SP500 Emini charts (Al on leave). Here are several reasonable stop entry setups from yesterday. I show each buy entry with a green rectangle and each sell […]
Bitcoin Breakout Mode
Market Overview: Bitcoin Futures Bitcoin breakout mode and inside bar on weekly chart. The price increased its value by +0.71% during the week. Traders wonder if this is the beginning of a small pullback bull trend or if a bear leg and test down to the 2022 low is about to start. Bitcoin futures The Weekly […]
NASDAQ 100 Pause after Strong Move Up
Market Overview: NASDAQ 100 Emini Futures The NASDAQ Emini futures market had a weak doji sell signal pause after strong move up of last week. Since this week is a bad signal bar, it will likely get bought. As last week’s report mentioned, there are targets above. NASDAQ 100 Emini futures The Weekly NASDAQ chart […]
Emini in Breakout Mode Just Under Important Resistance
Trading Update: Thursday February 9, 2023 Emini pre-open market analysis Emini daily chart Emini 5-minute chart and what to expect today Yesterday’s Emini setups Al created the SP500 Emini charts. Here are several reasonable stop entry setups from yesterday. I show each buy entry with a green rectangle and each sell entry with a red […]
Emini in Tight Trading Range — Breakout Mode
Trading Update: Thursday January 5, 2023 Emini pre-open market analysis Emini daily chart Emini 5-minute chart and what to expect today Emini intraday market update Yesterday’s Emini setups Brad created the SP500 Emini charts. Here are several reasonable stop entry setups from yesterday. I show each buy entry with a green rectangle and each sell […]

