Trading Update: Monday June 5, 2023 S&P Emini pre-open market analysis Emini daily chart Emini 5-minute chart and what to expect today Emini intraday market update Friday’s Emini setups Al created the SP500 Emini charts. Here are several reasonable stop entry setups from Friday. I show each buy entry with a green rectangle and each […]
If you are not seeing the latest Weekly Report below, your PC/device browser is likely showing you an earlier page copy. Simply refresh your browser. For PCs you can use the F5 key, or Ctrl-F5, several times if needed.
Emini Breakout above February 2 High
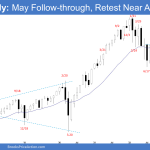
Market Overview: S&P 500 Emini Futures The S&P 500 Emini futures breakout above the February 2 high this week. The bulls will need to create follow-through buying next week to increase the odds of higher prices. The bears want a failed breakout above the February 2 high. If the Emini trades higher, they want a […]
Crude Oil Weak Second Leg Retest of May Low
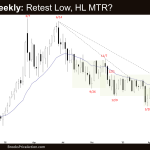
Market Overview: Crude Oil Futures The Crude oil futures formed a weak second leg retest of May low on the weekly chart. The market traded lower but reversed higher to close above the middle of the weekly candlestick with a long tail below. The bears hope to get follow-through selling next week and a retest of the […]
EURUSD Micro Double Top
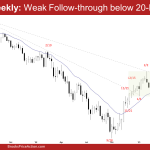
Market Overview: EURUSD Forex The EURUSD Forex traded down in May from a EURUSD micro double top (April and May) and closed below the 20-month exponential moving average. The bears need to create follow-through selling in June to increase the odds of a deeper pullback. The bulls want the broad bull channel to continue up […]
Bitcoin Reversal Down Attempt from Monthly Chart Resistance
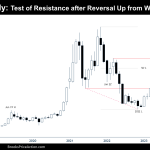
Market Overview: Bitcoin Futures Bitcoin reversal down attempt from a monthly chart resistance. During May, the price decreased its value by 7.89%. At the end of the first quarter of the current year (Q1) we have said that the closing price in March could be the most important price during the Q2; so far, the […]
DAX 40 Failed Breakout above All-time High or Pullback?
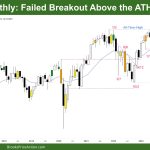
Market Overview: DAX 40 Futures DAX futures moved down with a Dax 40 failed breakout making a new All-time High (ATH) last month. When higher time frames (HTF) signals get triggered, they often pull back first. It is confusing as it was a tight trading range (TTR) to the left and a possible double top […]
Nasdaq Breakout above August 2022 Swing High
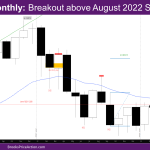
Market Overview: NASDAQ 100 Emini Futures NASDAQ Emini futures May monthly candlestick is a big bull trend bar with small tails, and breakout above August 2022 swing high and March high. At this point, the bar is also far above the monthly exponential moving average (EMA). This week closed as a non-climactic bull trend bar after […]
Nifty 50 Wedge Top on Monthly
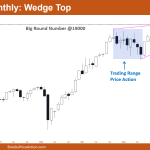
Market Overview: Nifty 50 Futures Nifty 50 wedge top on monthly chart where Nifty 50 produced a series of bull closes, but the bull bar has a small body. Market is getting close to the big round number and the all-time high level, which will act as powerful price resistance. The market is trading inside a tight […]
FTSE 100 Bear Surprise Pullback, Buyers at MA
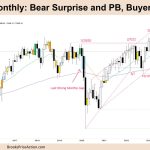
Market Overview: FTSE 100 Futures FTSE futures market moved lower last month with a bear surprise pullback closing above the MA. Bulls see a pullback to the moving average (MA) and have bought here for 2 years. They will likely do so until it is no longer profitable. Bears will look to sell a pullback, […]
Emini Breaking above February High
Trading Update: Friday June 2, 2023 S&P Emini pre-open market analysis Emini daily chart Emini 5-minute chart and what to expect today Emini intraday market update Yesterday’s Emini setups Al created the SP500 Emini charts. Here are several reasonable stop entry setups from yesterday. I show each buy entry with a green rectangle and each […]

