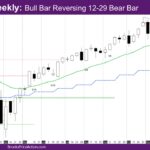
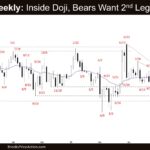
Market Overview: NASDAQ 100 E-mini Futures The NASDAQ E-mini futures week is a bull bar reversing 12-29 bear bar. The weekly and daily chart is at the apex of a triangle, with a bull bar on the daily chart at the daily exponential moving average (EMA). NASDAQ 100 Emini futures The Weekly NASDAQ chart The […]
If you are not seeing the latest Weekly Report below, your PC/device browser is likely showing you an earlier page copy. Simply refresh your browser. For PCs you can use the F5 key, or Ctrl-F5, several times if needed.
Nifty 50 Bear Outside Bar
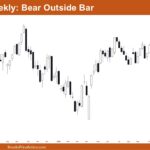
Market Overview: Nifty 50 Futures Nifty 50 Bear Outside Bar on the weekly chart. This week, the market gave a very strong bear close, closing below several previous weekly bars. In the previous week, the bulls attempted a breakout, but they failed to get good follow-through this week. On the daily chart, Nifty 50 gave […]
E-mini Profit Taking Near All-Time High
Trading Update: Friday January 9, 2026 S&P E-mini market analysis E-mini daily chart E-mini 5-minute chart and what to expect today Yesterday’s E-mini setups Richard created the SP500 E-mini chart. Here are reasonable stop entry setups from yesterday. Chart shows each buy entry bar with a green arrow and each sell entry bar with a […]
E-mini Sellers at 7,000 Round Number
Trading Update: Thursday January 8, 2026 S&P E-mini market analysis E-mini daily chart E-mini 5-minute chart and what to expect today Yesterday’s E-mini setups Jed created the SP500 E-mini chart. Here are reasonable stop entry setups from yesterday. Chart shows each buy entry bar with a green arrow and each sell entry bar with a […]
E-mini Testing All-time High and 7,000 Round Number
Trading Update: Wednesday January 7, 2026 S&P E-mini market analysis E-mini daily chart E-mini 5-minute chart and what to expect today Yesterday’s E-mini setups Richard created the SP500 E-mini chart. Here are reasonable stop entry setups from yesterday. Chart shows each buy entry bar with a green arrow and each sell entry bar with a […]
E-mini Unable to Escape Test of All-Time High
Trading Update: Tuesday January 6, 2026 S&P E-mini market analysis E-mini daily chart E-mini 5-minute chart and what to expect today Yesterday’s E-mini setups Richard created the SP500 E-mini chart. Here are reasonable stop entry setups from yesterday. Chart shows each buy entry bar with a green arrow and each sell entry bar with a […]
E-mini Breakout Mode near All-Time High
Trading Update: Monday January 5, 2026 E-mini end of day video review Follow Joseph’s YouTube channel for more Al Brooks price action analysis. S&P E-mini market analysis E-mini daily chart E-mini 5-minute chart and what to expect today Friday’s E-mini setups Richard created the SP500 E-mini chart. Here are reasonable stop entry setups from Friday. […]
Monthly E-mini Sideways Trading Range
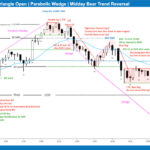
Market Overview: S&P 500 E-mini Futures The market formed a monthly E-mini sideways trading range in the last couple of months. Bulls want a resumption of the bull trend, with targets at the 7,200 round number and a 7,400 measured move based on the height of the recent trading range. Bears want a reversal from […]
Monthly Crude Oil Bear Leg
Market Overview: Crude Oil Futures The market formed a monthly Crude Oil bear leg within the trading range. Bears need sustained follow-through selling breaking below the December low to increase the odds of testing the trading range low. Bulls need consecutive strong bull bars breaking above the 7-bar bear microchannel and the 20-month EMA to […]
Monthly EURUSD Double Bottom Bull Flag
Market Overview: EURUSD Forex The market formed a monthly EURUSD double bottom bull flag (August 1 and November 5). Bulls need strong follow-through buying breaking above the September 17 high to increase the odds of the bull trend resuming. Bears want a reversal from a wedge top (April 21, July 1, and September 17) and […]

