Trading Update: Friday December 12, 2025 E-mini end of day video review Follow Joseph’s YouTube channel for more Al Brooks price action analysis. S&P E-mini market analysis E-mini daily chart E-mini 5-minute chart and what to expect today Yesterday’s E-mini setups Richard created the SP500 E-mini chart. Here are reasonable stop entry setups from yesterday. […]
If you are not seeing the latest Weekly Report below, your PC/device browser is likely showing you an earlier page copy. Simply refresh your browser. For PCs you can use the F5 key, or Ctrl-F5, several times if needed.
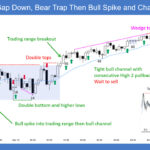
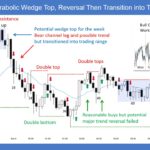
Bitcoin Gap Down, Big Opening Range Then Bull Trend

End of Day Video Report for December 11, 2025 Duration 5 min 45 secs. AI is voicing Josep Capo’s original script. Summary Bitcoin opened with a Big Gap Down offering a challenging session for breakout traders but excellent for those focused on fading bears and reversals—the swings were clear and decisive. Having the bias that […]
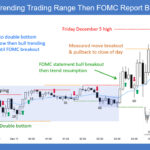
E-mini Daily Chart In Breakout Mode
Trading Update: Thursday December 11, 2025 S&P E-mini market analysis E-mini daily chart E-mini 5-minute chart and what to expect today Yesterday’s E-mini setups Richard created the SP500 E-mini chart. Here are reasonable stop entry setups from yesterday. Chart shows each buy entry bar with a green arrow and each sell entry bar with a […]
E-mini Breakout Mode Going into FOMC
Trading Update: Wednesday December 10, 2025 S&P E-mini market analysis E-mini daily chart E-mini 5-minute chart and what to expect today Yesterday’s E-mini setups Richard created the SP500 E-mini chart. Here are reasonable stop entry setups from yesterday. Chart shows each buy entry bar with a green arrow and each sell entry bar with a […]
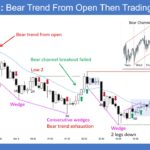
Bitcoin Small Range Then Bull Breakout
End of Day Video Report for December 9, 2025 Duration 4 mins. AI is voicing Josep Capo’s original script. Summary Bitcoin 15-minute chart showed a small range then bull breakout. Tokyo and London formed a tight trading range with a few reasonable scalps. The real move came in New York with a clear bullish range […]
E-Mini Bulls Want Rally to Year End
Trading Update: Tuesday December 9, 2025 S&P E-mini market analysis E-mini daily chart E-mini 5-minute chart and what to expect today Yesterday’s E-mini setups Richard created the SP500 E-mini chart. Here are reasonable stop entry setups from yesterday. Chart shows each buy entry bar with a green arrow and each sell entry bar with a […]
E-mini Second Leg Up Likely
Trading Update: Monday December 8, 2025 S&P E-mini market analysis E-mini daily chart E-mini 5-minute chart and what to expect today Friday’s E-mini setups Richard created the SP500 E-mini chart. Here are reasonable stop entry setups from Friday. Chart shows each buy entry bar with a green arrow and each sell entry bar with a […]
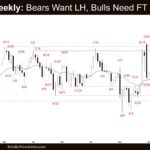
Weekly E-mini Bulls Need Follow-through Buying
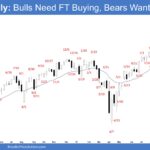
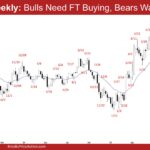
Market Overview: S&P 500 E-mini Futures The weekly E-mini bulls need follow-through buying breaking strongly above the October 29 high. If the market trades lower, they want the 20-week EMA to act as support. Bears hope the market stalls near the November 12 high area, forming a double top bear flag and a lower high […]
Weekly Crude Oil Bulls Need Strong Follow-through Buying
Market Overview: Crude Oil Futures The weekly Crude oil bulls need strong follow-through buying closing far above the 20-week EMA and the bear trendline to show they are taking control. If the market trades higher, bears want the 20-week EMA and the bear trendline to hold as resistance, forming another major lower high. Crude oil […]
EURUSD Broke Above the Bear Trendline
Market Overview: EURUSD Forex The EURUSD broke above the bear trendline this week. Bulls now need additional follow-through buying, trading clearly above the 20-week EMA and the bear trendline, to raise the odds of trend resumption. Bears see the current pullback (bounce) as forming a double top bear flag (Nov 13 and Dec 4) and […]

