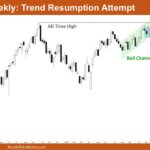
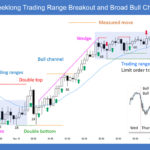
Market Overview: Nifty 50 Futures Nifty 50 Trend Resumption Attempt on the weekly chart. This week, the market closed with a strong bull bar after last week’s weak bear close. This bull bar has broken the previous bar’s high, forming a high-1 breakout. However, traders should keep in mind that the all-time high is just […]
If you are not seeing the latest Weekly Report below, your PC/device browser is likely showing you an earlier page copy. Simply refresh your browser. For PCs you can use the F5 key, or Ctrl-F5, several times if needed.
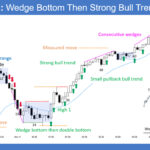
Nasdaq 100 Bear Doji Bar with Close Above 11-3 Low
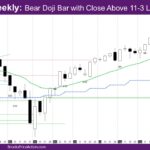
Market Overview: NASDAQ 100 Emini Futures The NASDAQ Emini futures week is a bear doji bar with close above 11-3 low. The daily chart got above the daily exponential moving average (EMA) to around the close of the buy signal bar from last week. There, it found sellers and ended the week below the EMA […]
E-mini Sell Vacuum Down to 6,700
Trading Update: Friday November 14, 2025 S&P E-mini market analysis E-mini daily chart E-mini 5-minute chart and what to expect today Yesterday’s E-mini setups Richard created the SP500 E-mini chart – Al travelling. Here are reasonable stop entry setups from yesterday. I show each buy entry bar with a green arrow and each sell entry […]
Bitcoin Breakout Mode and Then Small Pullback Bear Trend

End of Day Video Report for November 13, 2025 Duration 5 mins. AI is voicing Josep Capo’s original script. Summary The Bitcoin market delivered a Breakout Mode Pattern followed by a Small Pullback Bear Trend Day.
E-mini Trading Range Price Action on Daily Chart
Trading Update: Thursday November 13, 2025 E-mini end of day video review Follow Joseph’s YouTube channel for more Al Brooks price action analysis. S&P E-mini market analysis E-mini daily chart E-mini 5-minute chart and what to expect today Yesterday’s E-mini setups Richard created the SP500 E-mini chart – Al travelling. Here are reasonable stop entry […]
E-Mini Bulls Likely to Get 2nd Leg Up
Trading Update: Wednesday November 12, 2025 E-mini end of day video review Follow Joseph’s YouTube channel for more Al Brooks price action analysis. S&P E-mini market analysis E-mini daily chart E-mini 5-minute chart and what to expect today Yesterday’s E-mini setups Richard created the SP500 E-mini chart – Al travelling. Here are reasonable stop entry […]
Bitcoin Measured Move Down of the Opening Range
End of Day Video Report for November 11, 2025 Duration 5 mins. AI is voicing Josep Capo’s original script. Summary The Bitcoin market achieved a Measured Move down of the initial range but the market cycle was a bear trending trading range, a type of profile that is hard to trade.
E-mini Strong Reversal Up After Test of October 10th Low
Trading Update: Tuesday November 11, 2025 S&P E-mini market analysis E-mini daily chart E-mini 5-minute chart and what to expect today Yesterday’s E-mini setups Richard created the SP500 E-mini chart – Al travelling. Here are reasonable stop entry setups from yesterday. I show each buy entry bar with a green arrow and each sell entry […]
Bitcoin Opening Range Big Sell Climax
End of Day Video Report for November 10, 2025 Duration 5 mins. AI is voicing Josep Capo’s original script. Summary Bitcoin opening range encompassed the full anticipated daily range, enforcing trading-range conditions for the remainder.
E-mini Buyers on Test of October 10th Close
Trading Update: Monday November 10, 2025 S&P E-mini market analysis E-mini daily chart E-mini 5-minute chart and what to expect today Friday’s E-mini setups Richard created the SP500 E-mini chart – Al travelling. Here are reasonable stop entry setups from Friday. I show each buy entry bar with a green arrow and each sell entry […]

