Trading Update: Wednesday October 15, 2025 E-mini end of day video review S&P E-mini market analysis E-mini daily chart E-mini 5-minute chart and what to expect today Yesterday’s E-mini setups Richard created the SP500 E-mini chart – Al travelling. Here are reasonable stop entry setups from yesterday. I show each buy entry bar with a […]
If you are not seeing the latest Weekly Report below, your PC/device browser is likely showing you an earlier page copy. Simply refresh your browser. For PCs you can use the F5 key, or Ctrl-F5, several times if needed.
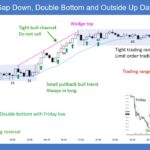
E-mini Testing Last Friday’s Close
Trading Update: Tuesday October 14, 2025 S&P E-mini market analysis E-mini daily chart E-mini 5-minute chart and what to expect today Yesterday’s E-mini setups Richard created the SP500 E-mini chart – Al travelling. Here are reasonable stop entry setups from yesterday. I show each buy entry bar with a green arrow and each sell entry […]
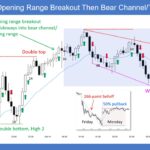
Emini Strong Downside Breakout
Trading Update: Monday October 13, 2025 S&P Emini market analysis Emini daily chart Emini 5-minute chart and what to expect today Summary of today’s S&P Emini price action Richard created the SP500 Emini chart – Al travelling Here are reasonable stop entry setups from yesterday. I show each buy entry bar with a green arrow […]
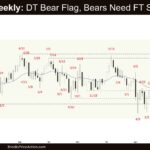
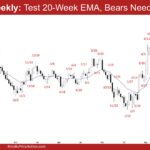
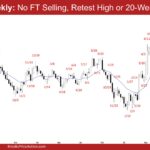
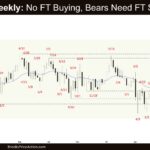
E-mini Bears Need Follow-through Selling
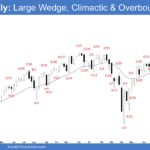
Market Overview: S&P 500 E-mini Futures The S&P 500 E-mini bears need follow-through selling on the weekly chart, something they couldn’t do since the April low. If the market trades lower, the bulls want the 20-week EMA or the September 2 low area to act as support. S&P500 E-mini futures The Weekly S&P 500 E-mini […]
Crude Oil Breakout From the Trading Range
Market Overview: Crude Oil Futures Crude Oil breakout from the trading range this week and the bears need follow-through selling. They want a measured move based on the height of the recent trading range, which will take the market to the $55 area. The bulls need to create strong bull bars trading above the 20-week […]
Large Weekly EURUSD Double Bottom Bull Flag
Market Overview: EURUSD Forex The market is forming a large weekly EURUSD double bottom bull flag (Aug 1 and Oct 9). The bulls want the 20-week EMA or the August 1 low to act as support. The bears must create consecutive bear bars closing near their lows, breaking far below the 20-week EMA and the […]
Nifty 50 Strong Bull Close
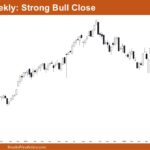
Market Overview: Nifty 50 Futures Nifty 50 Strong Bull Close on the weekly chart. This week, the market closed strongly on a bullish note near the upper trend line of the triangle pattern. The market is not yet in breakout mode, and the chances of a successful breakout are roughly 50-50 in either direction. Since […]
Nasdaq 100 Big Bear Reversal Bar at Monthly Measured Move Bull Target
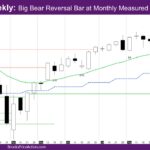
Market Overview: NASDAQ 100 Emini Futures The NASDAQ Emini futures week is a big bear reversal bar at monthly measured move bull target mentioned in prior reports. The daily chart is alternating bull/bear bars for the week, except Friday, which is a big bear bar closing far below the daily exponential moving average (EMA). The […]
Monthly EURUSD Wedge Pattern
The market formed a monthly EURUSD wedge pattern (Apr 21, Jul 1, and Sept 17). The bears want the bear trend line and the upper third of the multi-year trading range to be areas of resistance. The bulls want a retest of the September 17 high, even if it only forms a lower high. If […]
Monthly Crude Oil Trading Around the Middle of Trading Range
The monthly Crude Oil trading around the middle of trading range (20-month EMA) for the last few months. The bears need to create follow-through selling below the 20-month EMA to increase the odds of testing the trading range low. The bulls view the current move as a pullback and want it to form a higher […]

