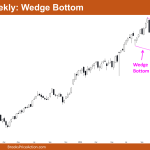
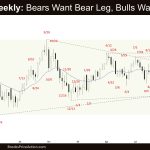
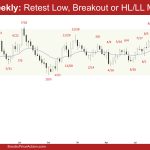
Market Overview: Nifty 50 Futures Nifty 50 Wedge Bottom on the weekly chart. This week, the market closed with a weak bullish sentiment and has yet to break out of the wedge bottom. It is also forming inside and outside bars, indicating a trading range price action. On the daily chart, Nifty 50 is trading […]
If you are not seeing the latest Weekly Report below, your PC/device browser is likely showing you an earlier page copy. Simply refresh your browser. For PCs you can use the F5 key, or Ctrl-F5, several times if needed.
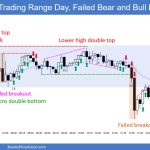
Emini Likely to Pullback for a Day or Two
Trading Update: Friday February 7, 2025 Emini end of day video review Follow Joseph’s YouTube channel for more Al Brooks price action analysis. S&P Emini market analysis Emini daily chart Emini 5-minute chart and what to expect today Yesterday’s Emini setups Al created the SP500 Emini charts. Here are reasonable stop entry setups from yesterday. […]
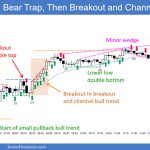
Emini Buyers Likely below First Pullback
Trading Update: Thursday February 6, 2025 S&P Emini market analysis Emini daily chart Emini 5-minute chart and what to expect today Yesterday’s Emini setups Al created the SP500 Emini charts. Here are reasonable stop entry setups from yesterday. I show each buy entry bar with a green arrow and each sell entry bar with a […]
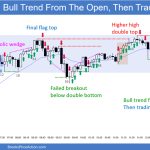
Emini Flat Moving Average on Daily
Trading Update: Wednesday February 5, 2025 S&P Emini market analysis Emini daily chart Emini 5-minute chart and what to expect today Yesterday’s Emini setups Al created the SP500 Emini charts. Here are reasonable stop entry setups from yesterday. I show each buy entry bar with a green arrow and each sell entry bar with a […]
Emini Reversal Up Following Monday’s Gap Down
Trading Update: Tuesday February 4, 2025 Emini end of day video review Follow Joseph’s YouTube channel for more Al Brooks price action analysis. S&P Emini market analysis Emini daily chart Emini 5-minute chart and what to expect today Yesterday’s Emini setups Al created the SP500 Emini charts. Here are reasonable stop entry setups from yesterday. […]
Emini Large 2nd Leg Down on Daily
Trading Update: Monday February 3, 2025 S&P Emini market analysis Emini daily chart Emini 5-minute chart and what to expect today Yesterday’s Emini setups Al created the SP500 Emini charts. Here are reasonable stop entry setups from yesterday. I show each buy entry bar with a green arrow and each sell entry bar with a […]
Weak Emini Follow-through Selling
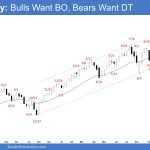
Market Overview: S&P 500 Emini Futures The market formed weak Emini follow-through selling on the monthly chart. The bulls want February to break into new all-time highs followed by a measured move based on the height of the recent sideways trading range. If the market trades higher, they hope the recent sideways trading range will […]
Monthly Crude Oil Lower High
Market Overview: Crude Oil Futures The market formed a monthly Crude Oil lower high, closing the monthly candlestick with a long tail above. The bears want the market to form another lower high and a failed breakout from the triangle pattern. The bulls hope to get a retest of the July 15 high, even if […]
Weak EURUSD Follow-through Selling
Market Overview: EURUSD Forex The market formed a weak EURUSD follow-through selling below the trading range. The bears hope to get at least a small sideways to down leg to retest the recent leg extreme low (Jan 13). The bulls want a failed breakout below the trading range and a reversal from a large double […]
Bitcoin January Outside Bar reclaim $100,000
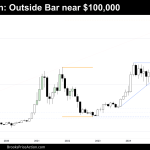
Market Overview: Bitcoin As January concludes, Bitcoin showcases impressive resilience, closing nearly 10% above December’s mark. Such a surge invites a deeper examination of Bitcoin’s price action across multiple timeframes, offering insights into prevailing risk management, trends, potential breakouts, and key support and resistance levels. Bitcoin The Monthly chart of Bitcoin The monthly chart reveals […]

