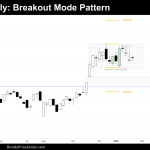
Market Overview: Bitcoin On the weekly chart, Bitcoin continues within a Breakout Mode Pattern (BOM) that follows a strong bull breakout from an 8-month Trading Range that had developed over the past year. On the daily chart, a BOM pattern that formed at the top of a trading range has already broken to the downside. […]
If you are not seeing the latest Weekly Report below, your PC/device browser is likely showing you an earlier page copy. Simply refresh your browser. For PCs you can use the F5 key, or Ctrl-F5, several times if needed.
Weekly Emini Retest of All-Time High
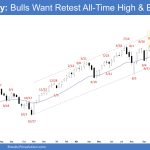
Market Overview: S&P 500 Emini Futures The market s forming a weekly Emini retest of all-time high. The bulls want a breakout into new all-time highs followed by a measured move based on the height of the 21-week trading range. The bears want a reversal from a double top (Dec 6 and Jan 24) and […]
Crude Oil Bears Want a Strong Bear Leg
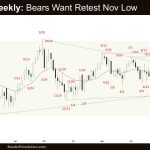
Market Overview: Crude Oil Futures The Crude Oil bears want a strong bear leg to retest the November low area. They need to create a follow-through bear bar following this week’s close below the 20-week EMA. The bulls need to create strong bull bars closing near their highs to show that they are back in […]
EURUSD Bulls Need a Breakout
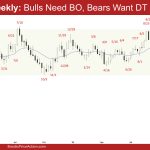
Market Overview: EURUSD Forex The EURUSD bulls need a breakout above the January 27 high with follow-through buying trading far above the bear trend line and the 20-week EMA to increase the odds of the bull leg beginning. The bears ope the 20-week EMA and the bear trend line will act as resistance. EURUSD Forex […]
FTSE 100: Using Price Action to Read the Futures Chart

Market Video Overview: FTSE 100 Futures Tim Fairweather’s weekly report on the FTSE 100 futures market. Follow Tim Fairweather’s YouTube channel for more Al Brooks price action analysis. Market analysis reports archive You can access all weekend reports on the Market Analysis page.
Trading the DAX 40 Futures – Weekly Price Action Breakdown

Market Video Overview: DAX 40 Futures Tim Fairweather’s weekly report on the DAX 40 futures market. Follow Tim Fairweather’s YouTube channel for more Al Brooks price action analysis. Market analysis reports archive You can access all weekend reports on the Market Analysis page.
Nasdaq 100 Best Bull Bar Since 12-2-24
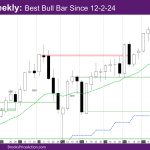
Market Overview: NASDAQ 100 Emini Futures The NASDAQ Emini futures week is a bull trend bar with almost no tails closing above last week’s high. It is the best bull bar since 12-2-24 and highest close of 2025. On the daily chart, the market is grinding up in a channel above the daily exponential moving […]
Nifty 50 Bear Channel
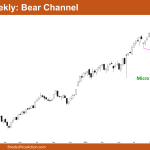
Market Overview: Nifty 50 Futures Nifty 50 Bear Channel on the weekly chart. The bulls attempted to break out of the wedge but failed to secure a strong close. Now, the bears are trying to achieve a successful bear breakout. The market is trading within a bear channel. On the daily chart, Nifty 50 is […]
Emini Bull Breakout of Triangle
Trading Update: Friday February 14, 2025 Emini end of day video review Follow Joseph’s YouTube channel for more Al Brooks price action analysis. S&P Emini market analysis Emini daily chart Emini 5-minute chart and what to expect today Yesterday’s Emini setups Al created the SP500 Emini charts. Here are reasonable stop entry setups from yesterday. […]
Emini Breakout Mode on Daily Chart
Trading Update: Thursday February 13, 2025 S&P Emini market analysis Emini daily chart Emini 5-minute chart and what to expect today Yesterday’s Emini setups Al created the SP500 Emini charts. Here are reasonable stop entry setups from yesterday. I show each buy entry bar with a green arrow and each sell entry bar with a […]

