Learning how to trade Emini S&P trend reversals is time well spent. A reversal bar on a candlestick chart is any bar with a tail on one end and its close near the other end. A bullish reversal bar has a close near its high, and a bearish reversal bar has a close near its low. The occurrence of a reversal bar indicates that traders drove the price in one direction but were over-powered by traders taking positions in the other direction and a trend reversal might follow.
Most times, though, a reversal bar is not a reliable stand alone signal, and should not be used as the basis for a countertrend trade. However, when they are shaped well, have an appropriate size, and occur in certain locations relative to the prior price action, they are consistently one of the best indicators.
Structure
An ideally shaped bullish reversal bar has its open around the middle of the bar, a tail at the bottom that is at least one-third of the entire candle, and a close that is at or near the high. This structure is reversed for a bearish reversal bar.
This shape stems from the market condition that at the start of the bar, sellers overwhelm buyers and drive the price down. However, the lower prices attract more buyers than sellers and these buyers drive the price back up above the open of the bar, causing the bar to close near its high. In other words, the bulls simply take control.
When other factors are present, traders looking to buy should be willing to buy at these higher prices with the expectation that the bulls are now in control and will push prices even higher over the next several bars. What a buyer is looking for is some indication from the price action that the market will continue to go up and allow him to exit at a profit with not too much risk. A bullish reversal bar can often provide that indication.
It is important to recognize that there is tremendous variation in the shape of reversal bars that result in profitable trades. They can have long tails, small or large bodies, and closes below the open, as long as the close is above the midpoint and preferably near the high. In any case, the best way to enter a long position is to wait for the bar to close and then place a buy stop at one tick above the high of the bar. The traditional approach also involves placing the protective sell stop at one tick below the low of the bar but if you read the price action correctly, you often only have to risk about four ticks on a five-minute E-mini chart.
Once the bulls are in control, they are not going to let the market drop five or six ticks to let other traders come in lower. Instead, they will buy more on a one- or two-tick dip. Also, if the market did in fact drop six ticks, smart traders would question the premise that the bulls are in control and probably want out of the trade.
Finally, once the five-minute chart has turned bullish, longer timeframes, such as the 15-, 30- and 60-minute charts will follow, drawing in even more buyers above the market. Though we are using five-minute E-mini S&P 500 price action for illustration, the principles apply to all markets, charts (such as volume-based charts), and timeframes.
This is also true for volume charts of all sizes (for example, charts where the bars are based on 10,000, 50,000, or 100,000 contracts).
Follow-through
Once a bull move begins, smart bulls will look at the close of every bar. If the bars continue to close near their highs, new bulls will enter as soon as the next bar begins; causing the bar to go up immediately after it opens. This will create a series of bars that open near the lows and close near the highs.
If there is enough upward momentum, buyers will buy at any price because they are confident that even if the market reverses back down, buyers will soon again overwhelm sellers and the market will make a new swing high, allowing them to exit with a profit.

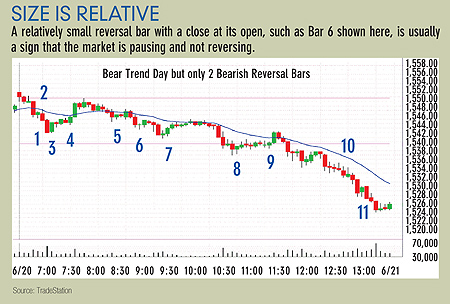
The size of a reversal bar is also important. For example, in “Size is relative” (above) Bar 6 is a reversal bar that is only five ticks tall. However, it formed after the market just dropped seven points (28 ticks) and it is relatively small compared to the prior bars. The market just traded below a swing low (seven bars earlier) and traders are watching the price action to see who is in control. What they see is a weak reversal bar, and weak reversal bars are better viewed as continuation patterns and not reversal set-ups.
The following bar was a small inside bar with a down close. Smart bulls who bought the reversal bar would have had enough disappointment and would exit. Smarter bulls would not have bought in the first place and instead would place an order to go short on a stop at one tick below that small bar. The smarter bull would know that all those traders who bought that small reversal bar will dump and look for a better entry.
The role of context
Location and context are crucial in deciding whether to place a trade based on a reversal bar. An important observation is that “Size is relative” shows a bear trend day with at least 11 reversal bars, yet nine of the 11 are bull reversal bars and only two are bear reversal bars. This is not an aberration.
Trend days typically have lots of reversal bars that sucker traders into the wrong direction; these traders subsequently provide much of the fuel that drives the trend. They buy and the market never gives them more than a couple ticks of profit and quickly puts them at a two- or three-tick loss. These weak buyers are turned into sellers, adding momentum to the downward trend.
The reason there are so many bullish reversal bars on a bear trend day is while even the most naïve bulls can tell it’s a down day, these traders live on hope. Also, if they are looking to get long, that means they missed the downtrend. Once you miss a trend, you look for an opportunity for the market to reverse rather than joining the party late.
Often, these traders will be looking at one- and three-minute charts or 5,000-share charts to get long at each reversal off each new swing low. They will buy quickly at the first sign that a bullish reversal bar might be forming, thinking that a one-minute bar is only about three or four ticks tall has very little risk. This happens on the one-minute chart, and then the three-minute, and finally the five-minute. At this point, all of the weakest longs have bought, and they will not buy any higher because they have already had five losing countertrend trades that day and know that there is too much risk at buying any higher.
Some smart bears who added to their short a few bars earlier will see this bullish reversal bar and take some scalpers’ profits. However, they are looking to reload. They simply don’t know how high the market will go before the inevitable stall develops, followed by the forced liquidation of the weak new longs. Also, they don’t want to exit most of their short position because they are expecting new lows and don’t want to have to worry about finding a place to re-enter shorts. They are holding short, looking to add on at higher prices, and they certainly are not buying.
When the bear breaks
The bear rally starts off quickly with a bullish reversal bar and a strong close near the high of the bar. However, there will only be a few ticks of follow-through buying because no one will buy much above the high of the reversal bar.
The new longs are weak and are hoping for a countertrend scalp. As such, they will only buy the bull reversal bar and perhaps a few ticks above. The smart bears will take profits on the scalp portion of their shorts when the bullish reversal bar forms, but they will not buy any higher. They are only looking to sell more, but there is no one left to buy after the bullish reversal bar forms. This results in one or two small up bars and then a stall once the buying stops.
The weak bulls are very nervous at this point. They were hoping for a huge up bar so they could move their protective stops to breakeven. Instead, they have at most a couple ticks of profit and the market has stopped going up. They immediately place a sell stop order to exit below the low of the prior bar to minimize their losses. The bears have been waiting for the small rally to run its course and will be looking to sell more once it stalls. Everyone is now looking to sell, so the bear resumes below the quiet pause bar in the absence of a bearish reversal bar.

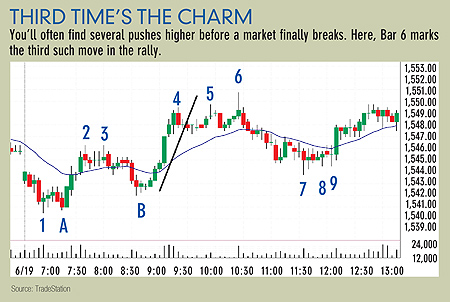
“Third time’s the charm” (above) has a large bearish reversal bar at the high of the day (Bar 6). The close is above the open but well below the midpoint. This is the third push up in this rally, which is a common reversal pattern. After a market has a strong move (the top of the strong up move was Bar 4), it often needs two attempts at a top before there is a correction, resulting in what’s known as a three push-up top.
Bar 5 was the first attempt, but the next bar did not give a signal; it did not trade below the low. Also, both it and the next bar were small and closed at the open, which usually identifies them as continuation patterns. The market made one more push higher and formed a large bearish reversal bar. A second attempt at a reversal is usually a strong signal. Combined with a large bearish reversal bar, the odds were high that the market would make a down move that should last at least an hour and extend at least twice the range of the large reversal bar, which it did.

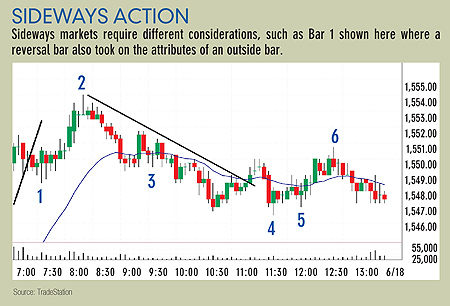
Bar 1 in “Sideways action” (above) is a large reversal bar but it developed in a sideways market so there was nothing to reverse. It was also an outside bar; its high and low are outside of those of the prior bar. Outside bars in sideways markets do not give direction. However, this outside bar had a low that was the low of the day and it had a strong close, indicating that the bulls were showing some strength. The next three bars were inside of each other, indicating that everyone was waiting for a breakout, which came on the upside. This was the more likely possibility because of the upward momentum of Bar 1. It would have made sense to have a buy stop at one tick above the second inside bar and a protective stop below that bar.
Bar 4 in “Sideways action” also has great shape but a bad location. Its body is entirely within the body of the prior bar. Too much overlap with the prior bar often results in sideways action, and it did here. However, Bar 5 was a breakout to the downside, but it closed above its open and midpoint, creating a second, albeit weak, reversal bar. Second attempts at reversing are always worth considering and a long entry here would have resulted in at least a scalper’s profit.
Confirmation keys
The reliability of a reversal bar is increased significantly if it occurs after a trendline is broken. A broken trendline is another sign that the trend has ended or is at least weakening. If the market then forms a reversal bar, the chances of a profitable entry are much better. For example, Bar 6 in “Third time’s the charm” followed a broken trendline, as did Bars 2 and 4 in “Sideways action.”

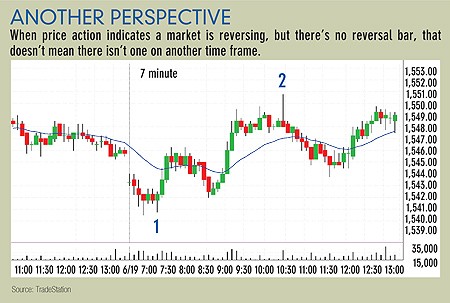
Another aspect to consider is that sometimes the market appears to be reversing over the course of two or three bars, but there is no reversal bar. In most cases, if you looked at different timeframes or styles of chart (such as a volume chart), you will eventually see a perfect reversal bar. While this is not practical when trading, it is reassuring to know. For example, “Another perspective” (above) is the same chart as, “Third time’s the charm,” except it is a seven-minute chart instead of a five-minute. Bar 1 is a great bullish reversal bar and corresponds to the two-bar higher low on the five-minute chart.
Take this advice with this warning however: Looking at anything other than a single chart when trading off price action is difficult because the charts will all show different patterns and rarely will confirm one another. By the time that you decide that you should take the trade, the move has already begun without you. It’s only worth mentioning to understand that if you were trading these other time frames, reversal bars could certainly occur independent of, say, the five-minute chart.
Trade what’s familiar — and keep it simple. Pick one time frame and stick to it so that you will not have to make a lot of extra decisions regarding stop placement and exits. If you have rules based on experience, everything will be automatic and you will be much better able to follow your rules with little thought or emotion. If you are experimenting with new time frames, you will not have rules and instead will be guessing, which is expensive.
This is based on an article from the December 01, 2007 issue of Futures magazine.